Swanson’s rule of thumb [1] says that the mean of a moderately skewed probability distribution can be approximated by the weighted average of the 10th, 50th, and 90th percentile, with weights 0.3, 0.4, and 0.3 respectively. Because it is based on percentiles, the rule is robust to outliers. Swanson’s rule is used in the oil and gas industry, but I don’t believe it’s widely known outside of that sector.
This post will apply Swanson’s rule to three distributions to see how well it does. I’ll plot the bias in Swanson’s rule and skewness for three distributions families as the shape parameters vary.
First, here’s a plot for the gamma distribution with shape parameter k varying from 0.5 to 10.
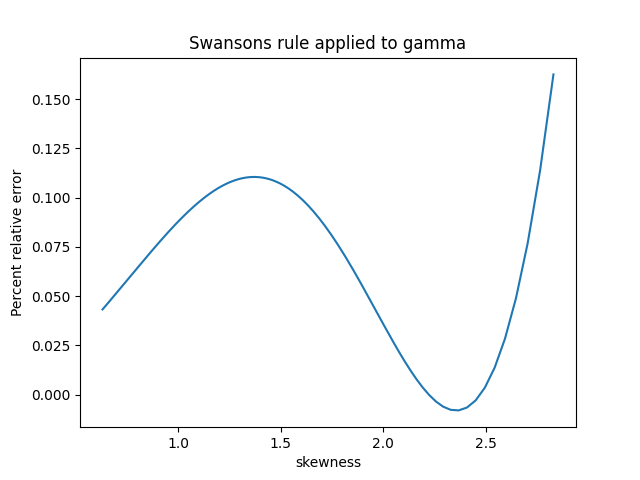
The skewness of a gamma distribution is 1/√k. So unless k is close to 0, the skewness of a gamma distribution is small and the error in Swanson’s rule is very small.
For the log normal I let the shape parameter σ vary from 0.01 to 1; I didn’t use larger parameters because skewness for the log normal increases very rapidly as a function of σ. Over the range I plotted the percentage relative error in Swanson’s rule is roughly equal to the skewness.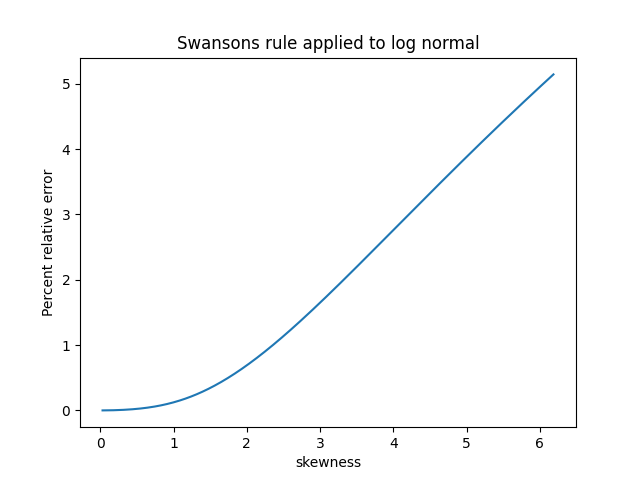
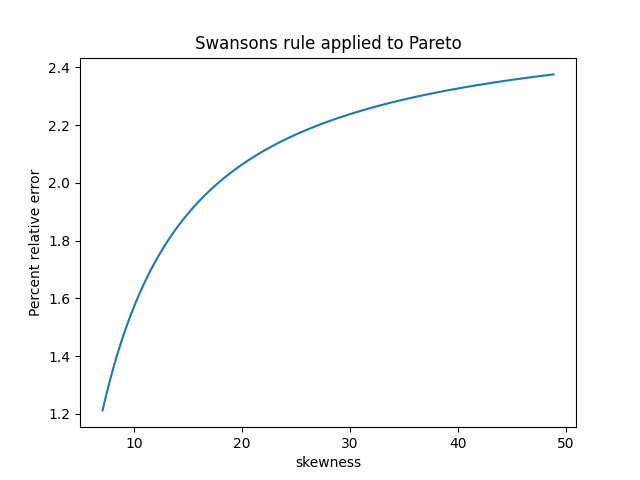
The skewness of a Pareto distribution is undefined unless the shape parameter is greater than 3. The plot below is based on shape parameters between 3.1 and 4. The skewness decreases as the shape parameter increases, asymptotically approaching 2.
Based on these examples, Swanson’s rule does indeed work pretty well when skewness is small. It works well for the gamma distribution in general because skewness is always small (unless the shape parameter k is tiny). But the log normal distribution shows that the assumption of small skewness is important.
For the Pareto distribution, Swanson’s rule works well when the shape parameter is large and the skewness is small. But this was kind of a stress test for Swanson’s rule because often the Pareto distribution is used when the skewness is large if not infinite.
[1] Swanson’s 30-40-30 rule. A. Hurst, G. C. Brown, R. I. Swanson. AAPG Bulletin, December 2000
For a while in the 1970s and ’80s, quantile-based estimates of descriptive statistics were all the rage. It’s not just the mean that is affected by outliers, but all central moments. The higher centralized moments (variance, skewness, kurtosis,…) are even more affected by outliers because those statistics have higher variance and are based on the traditional mean. Attempts to replace the Pearson-moment definition have a long history dating back to 1901. For a discussion of quantile-based definitions of the skewness, see “A quantile definition for skewness” at https://blogs.sas.com/content/iml/2017/07/19/quantile-skewness.html