The plot below is of a meromorphic function f(z). That is, the function f(z) is analytic except possibly at poles, and the colors represent the phase angles, the values of θ if you write the function values in polar form.
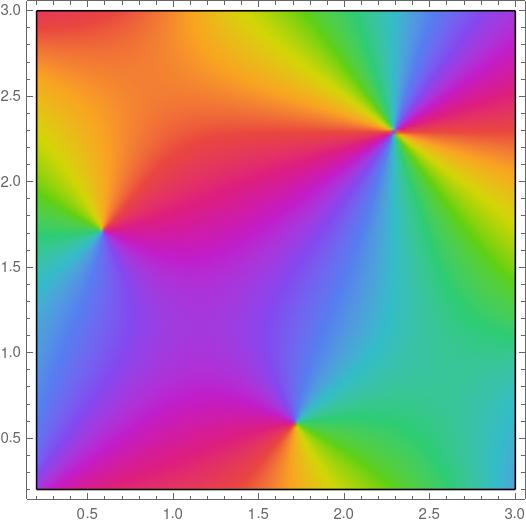
What is the value of the integral
![]()
where C is the perimeter of the square?
This hardly seems like enough information to go on. I haven’t even said what the function is. And yet all the information you need is there.
There are three important points inside the plot, the three points where the color swirls come to a point. The colors rotate around the point near the top right corner twice, and they rotate around the other two points once each, and in the opposite order.
This means that our function either has two zeros and a double pole, or two poles and a double zero. In order to know which is which we need to know the color convention. The plot was made with Mathematica, and colors go through ROYGBIV order counterclockwise as the angle increases. So we have the former case: two single zeros and one double pole. However, it turns out the integral would be the same in either case.
By the argument principle, the integral above counts the number of zeros minus the number of poles inside the region, counted with multiplicity. Each zero contributes +1 and the double pole contributes −2. The integral is zero.
Now suppose we cut the region along a diagonal from the top left to the bottom right. Let C be the perimeter of the right triangle below the diagonal and integrate around C counterclockwise. What’s the value of the integral?
It would be 2, because there are two zeros inside the triangle.
***
To learn more about interpreting contour plots, see this post. For more on the argument principle, read this post then this post.
In my previous posts on the argument principle, I only mentioned zeros. Everything holds for poles as well, if you flip the sign.
For the record, the function in the image is WeierstrassP[z, {1, I}].