The word “smooth” in mathematics usually means infinitely differentiable. Occasionally the word is used to mean a function has as many derivatives as necessary, but without being specific about how many derivatives that is.
A function is analytic if it has a convergent power series representation at every point of its domain. An analytic function is infinitely differentiable, but surprisingly the converse is not true.
Suppose we took a bump function as described in the previous post, say over the interval [−1, 1]. Such a function would be infinitely differentiable at 1, positive to the left of 1 and zero to the right. Let’s compute the power series centered at 1. All the derivatives are zero at 1, so all the power series coefficients are 0, so the power series sums to 0. The bump function is positive on the left side of 1 but the power series is not.
When does the power series of an infinitely differentiable function converge to that function? More on this subtle question here.
Now suppose we forge ahead and try to construct an analytic bump function. What goes wrong? Do we get something that is almost analytic?
Let’s follow the construction of the previous post, starting with
f(x) = exp(x).
Then
g(x) = 1 /f(1/x) = exp(−1/x)
and
h(x) = g(1 + x) g(1 − x) = exp(1/(1 − x²))
In Mathematica,
h[x_] := If[Abs[x] < 1, Exp[-1/(1 - x^2)], 0]
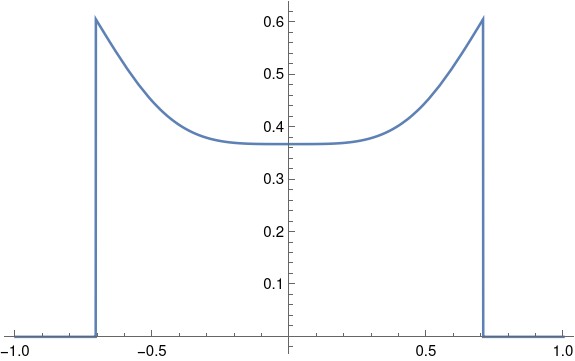
Now let’s look at h from several perspectives. Along the real axis, everything is fine.
Plot[h[x], {x, -1.1, 1.1}]
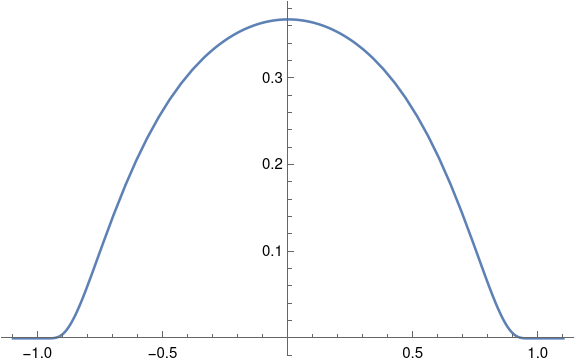
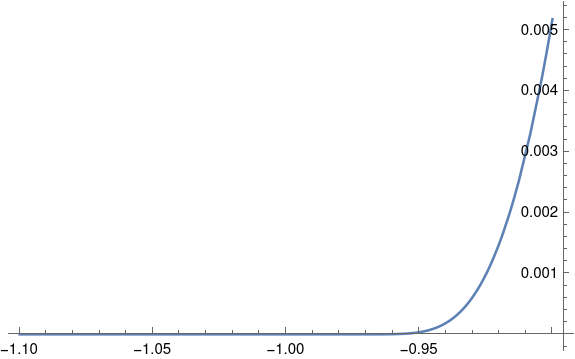
The function seems to drop to zero abruptly so that it might not be smooth, but zooming in a little reassures us that the function is indeed smooth.
Plot[h[x], {x, -1.1, -0.9}, PlotRange -> All]
What if we plot h as a complex function?
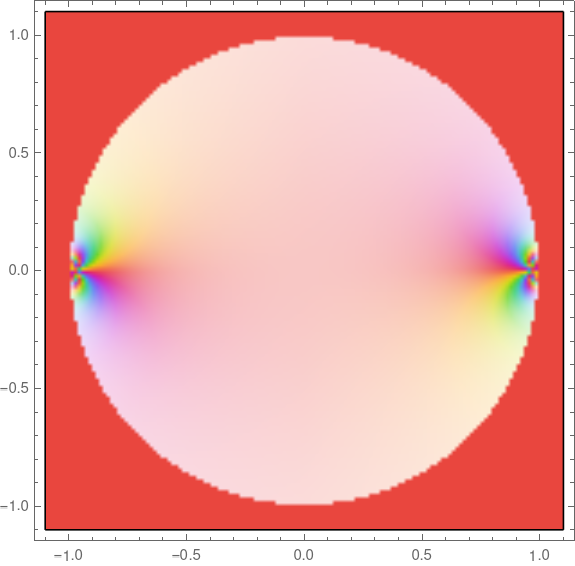
Now things don’t look so smooth. The swirls of color near -1 and 1 show that the phase is changing violently. Also, the light color in the unit circle compared to the dark color outside suggests the phase jumps when we cross the unit circle rather than smoothly transitioning to zero.
Let’s see what happens to the magnitude of h as we cut across the square above diagonally.
Plot[Abs[h[z I + z]], {z, -1, 1}]
Definitely not smooth. Not even continuous.
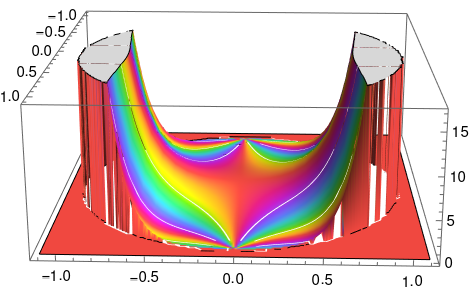
Let’s see what happens if we add a dimension to our plot, using |h(z)| as height.
ComplexPlot3D[h[z], {z, -1.1 - 1.1 I, 1.1 + 1.1 I}]
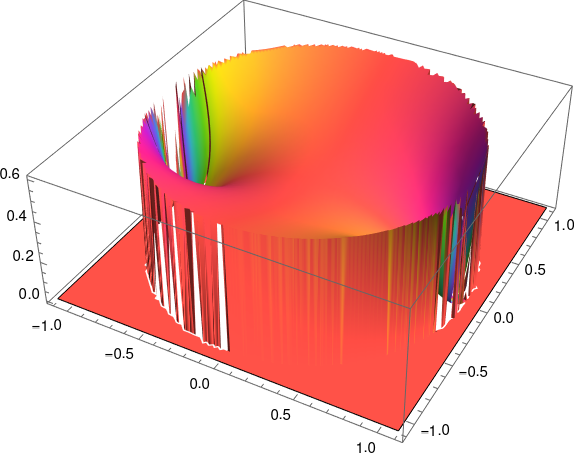
So a lot is happening at ±1. Let’s turn this plot around to look at it from a different perspective.
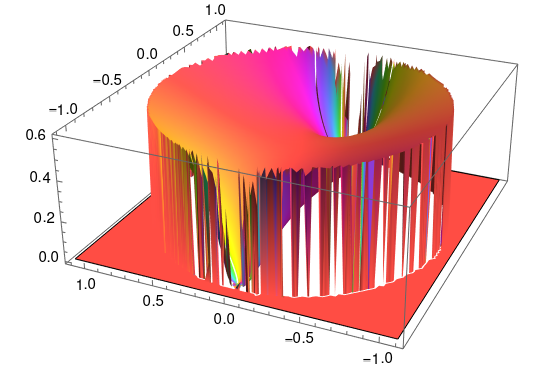
Our function has essential singularities at ±1 when we look at it in the complex plane. Along the real axis everything looks fine, but when we look at it from the complex plane we see that the function is very badly behaved.
Before we go, let’s go back and look at the example from the previous post, a bump function that is six derivatives along the real axis. What would it look like extended to the complex plane?
    h2[z_] := If[Abs[z] < 1, (1 + z)^7 (1 - z)^7, 0]
    ComplexPlot3D[h2[z], {z, -1.1 - 1.1 I, 1.1 + 1.1 I}]
This gives us
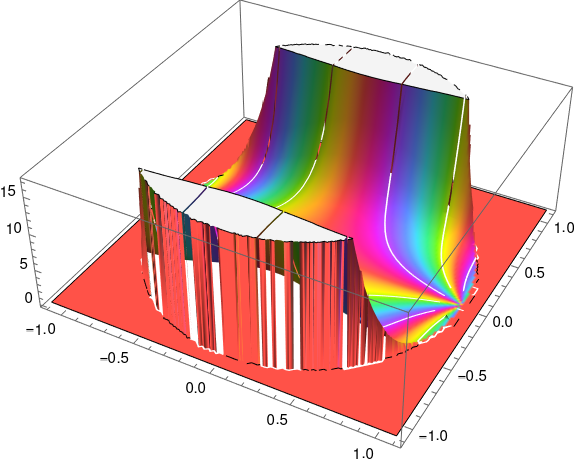
Here’s the same plot viewed from a different angle.