
A couple days ago I wrote about the likelihood of the better team winning a best-of-five or best-of-seven series. That is, if the probability of X winning a game against Y is p > ½, how likely is it that X will win a majority of 5 games or a majority of 7 games.
This assumes the probability of winning each game is fixed and that each game is independent. Actual sports series are more complicated than that.
I was thinking about the baseball playoffs, and so I chose series of 5 and 7. But some tennis fans asked me to add series of 3. And others asked me to add series of more than 7.
As reported in the earlier post,the probability of X winning a series of N games is
![]()
Here is a plot for series of 1, 3, 5, …, 29 games.
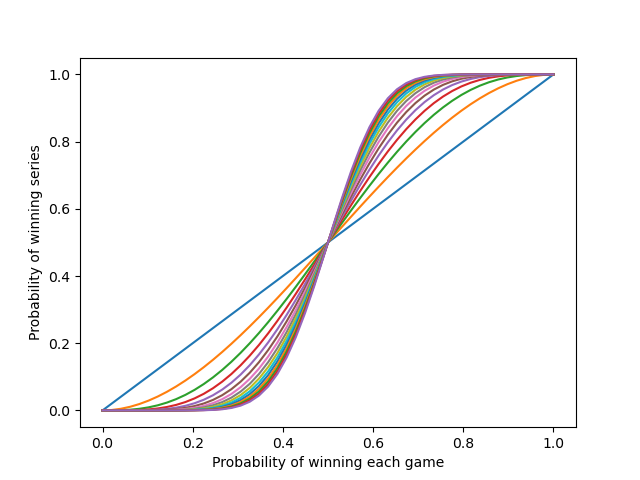
The blue diagonal line is the probability of winning each game, i.e. winning a 1-game series.
As you play longer series, the probability of the better team winning increases. Notice that you get the most lift from the diagonal line when playing a 3-game series, the orange line above. You get more lift going from 3 games to 5 games, from the orange line to the green line, though not as much. And as observed in the earlier post, you don’t get much improvement going from 5 games to 7 games, going from green to red.
Even with a series of 29 games, there’s a decent chance that the better team may not win the series, unless the better team is much better. The race is not always to the swift, nor the battle to the strong.
As you keep increasing the number of games N, the slope of the line in the middle becomes steeper, but slowly. You hit diminishing return immediately, with each additional pair of games making less and less difference. Still, the curve is getting steeper. Here’s the curve for a series of 499 games.
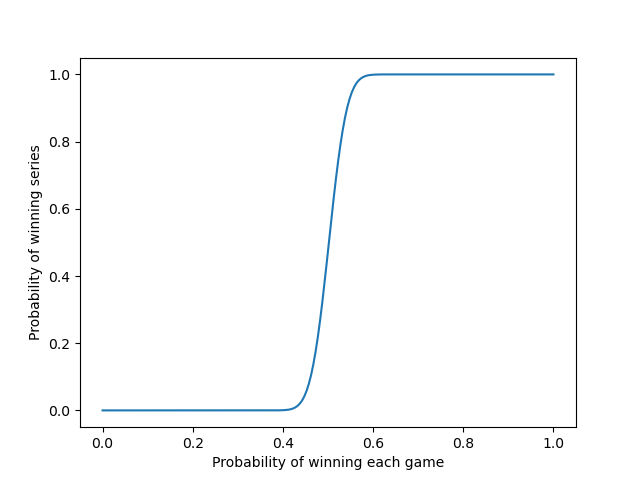
The slope of the curve in the middle is increasing in proportion to the square root of the number of games.
Related posts
Photo by J. Schiemann on Unsplash
So if X wins an N-game tournament, what is the probability that X is the better team? (Assuming that “being the better team” means “p > 1/2”.)
And a slightly different question would be, if X wins n out of N games, what is the probability that X is the better team?
All this would require defining a prior on p.
That is definitely food for thought. I immediately thought of a relevant follow-up question. Let’s say one has a truly better than average team. Let’s say we assign our fictitious team a 60% likelihood of winning any given game instead of 50/50. How much does that change the likelihood of the outcome for a 3, 5 or 7 game series? The question boils down to… is skill relatively important to the outcome or is “luck”?