Electrical hum

If you hear electrical equipment humming, it’s probably at a pitch of about 60 Hz since that’s the frequency of AC power, at least in North America. In Europe and most of Asia it’s a little lower at 50 Hz. Here’s an audio clip in a couple formats: wav, mp3.

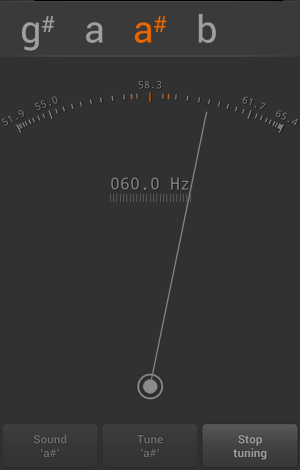
The screen shot above comes from a tuner app taken when I was around some electrical equipment. The pitch sometimes registered at A# and sometimes as B, and for good reason. In a previous post I derived the formula for converting frequencies to musical pitches:

h = 12 log(P / C) / log 2.

Here C is the pitch of middle C, 261.626 Hz, P is the frequency of your tone, and h is the number of half steps your tone is above middle C. When we stick P = 60 Hz into this formula, we get h = −25.49, so our electrical hum is half way between 25 and 26 half-steps below middle C. So that’s between a A# and a B two octaves below middle C.

For 50 Hz hum, h = −28.65. That would be between a G and a G#, a little closer to G.

Update: So why would the frequency of the sound match the frequency of the electricity? The magnetic fields generated by the current would push and pull parts, driving mechanical vibrations at the same frequency.

Related: Acoustics consulting

Remove noise, remove signal

Whenever you remove noise, you also remove at least some signal. Ideally you can remove a large portion of the noise and a small portion of the signal, but there’s always a trade-off between the two. Averaging things makes them more average.

Statistics has the related idea of bias-variance trade-off. An unfiltered signal has low bias but high variance. Filtering reduces the variance but introduces bias.

If you have a crackly recording, you want to remove the crackling and leave the music. If you do it well, you can remove most of the crackling effect and reveal the music, but the music signal will be slightly diminished. If you filter too aggressively, you’ll get rid of more noise, but create a dull version of the music. In the extreme, you get a single hum that’s the average of the entire recording.

This is a metaphor for life. If you only value your own opinion, you’re an idiot in the oldest sense of the word, someone in his or her own world. Your work may have a strong signal, but it also has a lot of noise. Getting even one outside opinion greatly cuts down on the noise. But it also cuts down on the signal to some extent. If you get too many opinions, the noise may be gone and the signal with it. Trying to please too many people leads to work that is offensively bland.

Related post: The cult of average

How to design a quiet room

How would you design a quiet study room? If you know a little about acoustics you might think to avoid hard floors, hard surfaces, parallel walls, and large open spaces. The reading room of the Life Science Library at the University of Texas does the opposite. And yet it is wonderfully quiet.

The room is basically a big box, maybe 100 ft long. The slightest noise reverberates throughout the room. But because the room is so live, the people inside are very quiet.

How loud is the evidence?

We sometimes speak of data as if data could talk. For example, we say such things as “What do the data say?” and “Let the data speak for themselves.” It turns out there’s a way to take this figure of speech seriously: Evidence can be meaningfully measured in decibels.

In acoustics, the intensity of a sound in decibels is given by

10 log10(P1/P0)

where P1 is the power of the sound and P0 is a reference value, the power in a sound at the threshold of human hearing.

In Bayesian statistics, the level of evidence in favor of a hypothesis H1 compared to a null hypothesis H0 can be measured in the same way as sound intensity if we take P0 and P1 to be the posterior probabilities of hypotheses H0 and H1 respectively.

Measuring statistical evidence in decibels provides a visceral interpretation. Psychologists have found that  human perception of stimulus intensity in general is logarithmic. And while natural logarithms are more mathematically convenient, logarithms base 10 are easier to interpret.

A 50-50 toss-up corresponds to 0 dB of evidence. Belief corresponds to positive decibels, disbelief to negative decibels. If an experiment shows H1 to be 100 times more likely than H0 then the experiment increased the evidence in favor of H1 by 20 dB.

A normal conversation is about 60 acoustic dB. Sixty dB of evidence corresponds to million to one odds. A train whistle at 500 feet produces 90 acoustic dB. Ninety dB of evidence corresponds to billion to one odds, data speaking loudly indeed.

To read more about evidence in decibels, see Chapter 4 of Probability Theory: The Logic of Science.