Here are a few diagrams I’ve created that summarize relationships in analysis and probability. Click on a thumbnail image to go to a page with the full image and explanatory text.
Special functions

Gamma and related functions
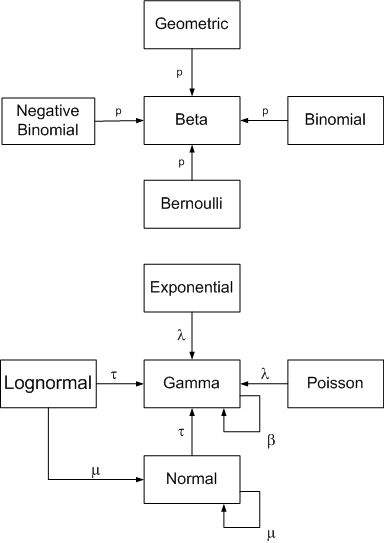
Probability distributions
Conjugate priors
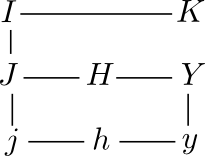
Convergence theorems
Bessel functions
Nice work, John.
What’s the difference between the solid and the dashed arrows? I ought to remember, but it has been a long time …
There other alternate names for some of these, such as “Almost Sure”. Including those would be helpful for people who learned them that way (me, at least).
The solid arrows from A to B means that if a sequence converges with definition A, it also converges with definition B. A dashed arrow means that if a sequence converges under definition A, there exists a subsequence that converges under definition B.
I mention probability terminology at the bottom, e.g. almost sure for almost everywhere, convergence in probability for convergence in measure, etc.
I like these diagrams. I wish they had more of these sorts of things in textbooks.