
Eberhard Zwicker proposed a model for combining several psychoacoustic metrics into one metric to quantify annoyance. It is a function of three things:
- N5, the 95th percentile of loudness, measured in sone (which is confusingly called the 5th percentile)
- ωS, a function of sharpness in asper and of loudness
- ωFR, fluctuation strength (in vacil), roughness (in asper), and loudness.
Specifically, Zwicker calculates PA, psychoacoutic annoyance, by
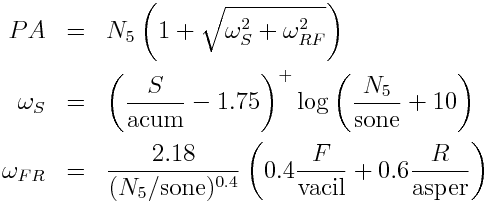
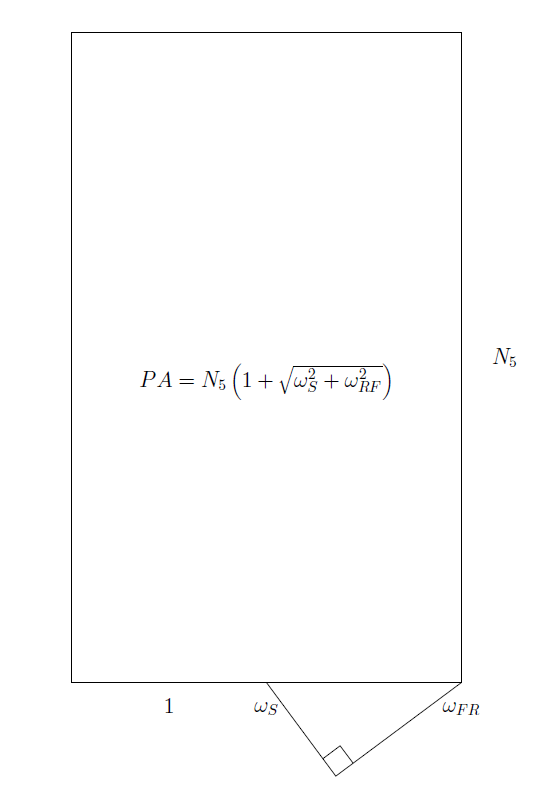
A geometric visualization of the formula is given below.
Here’s an example of computing roughness using two sound files from previous posts, a leaf blower and a simulated kettledrum. I calibrated both to have sound pressure level 80 dB. But because of the different composition of the sounds, i.e. more high frequency components in the leaf blower, the leaf blower is much louder than the kettledrum (39 sone vs 15 sone) at the same sound pressure level. The annoyance of the leaf blower works out to about 56 while the kettledrum was only about 19.
The geometrical visualization is making some presumption about relative scales, which is a little hard for me to understand, in that one axis has a unit and the other is dimensionless. What is the basis for making Ns so comparatively large?
Loudness is by far the most important component of annoyance. With data arising in application, the base of the rectangle might be roughly 2, while the height might be on the order of 100.