A very common task in probability and statistics is to estimate the probability of a normal random variable taking on a value larger than a given value x. By shifting and scaling we can assume our normal random variable has mean 0 and variance 1. This means we need to approximate the integral
![]()
We are interested in positive values of x, especially moderately large values of x.
We will estimate the integral above using the FWHM trick. This technique approximates the area under a curve by the area of a single rectangle.
The height of the rectangle is the maximum value of the integrand. The width is the distance between two points where the integrand takes on half its maximum value. The FWHM technique takes its name from the base of this rectangle: Full Width between points of Half Maximum.
In our example, the integrand is strictly decreasing over the region of integration. This means the maximum occurs at the beginning, at x, and there’s only one place where the integrand takes on half its maximum value. So the base of our rectangle runs from x to the point t where the integrand drops by a half.
To find t we need to solve
![]()
to get
![]()
It follows that
![]()
Note that the base of our rectangle, t − x, is on the order of 1/x, and so the estimate above is roughly similar to the rigorous bounds on normal tail probabilities given here.
So how good is the approximation? We can compute the error with the following Python code.
    import numpy as np
    import matplotlib.pyplot as plt
    from scipy.stats import norm

    x = np.linspace(1, 5, 100)
    approx = (2*np.pi)**-0.5 * np.exp(-x**2/2)
    approx *= ((x*x + 2*np.log(2))**0.5 - x)
    error = exact - approx
Here’s a plot of the error:
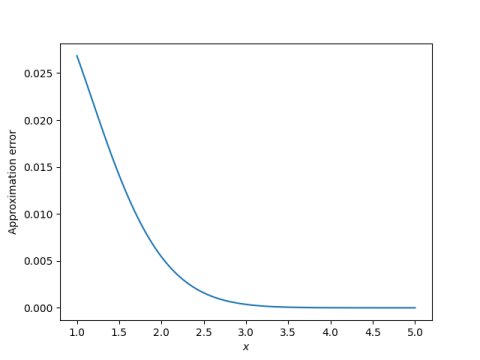
So the approximation error is small, and gets smaller as x increases. Depending on context, the error may be small enough.
However, Gaussian tail probabilities decrease rapidly, so we should ask whether the approximation error is small relative to the exact value. So we plot
relative = error/exact
Here the results are not as impressive.
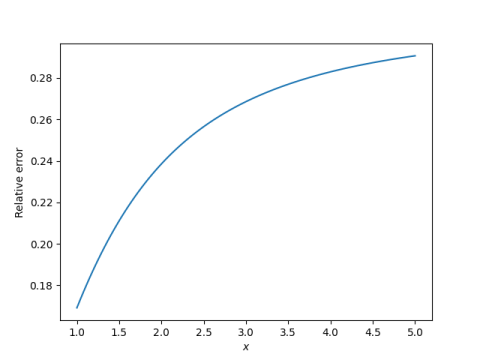
The relative error is on the order of 20%, and it actually increases as x increases. This tells us our approximation is not an asymptotic approximation. Still, it’s not bad for such a crude derivation.