What does it look like when you take the sine of a circle? Not the angle of points on a circle, but the circle itself as a set of points in the complex plane?
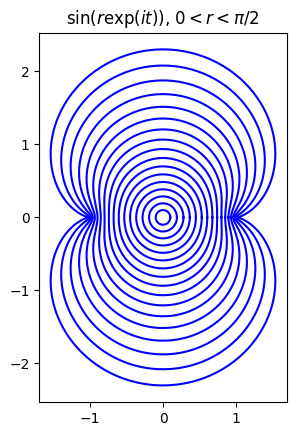
Here’s a plot for the sine of circles of radius r centered at the origin, 0 < r < π/2.
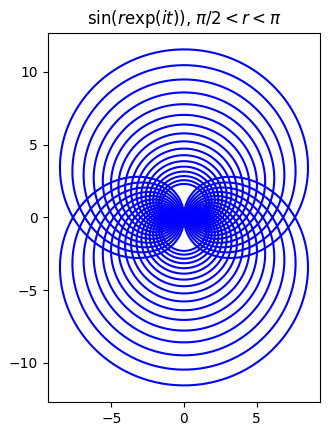
Here’s the same plot but for π/2 < r < π.
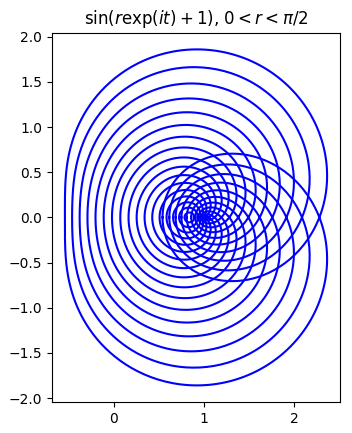
Now let’s see what happens when we shift the center of the circle over by 1, first for 0 < r < π/2.
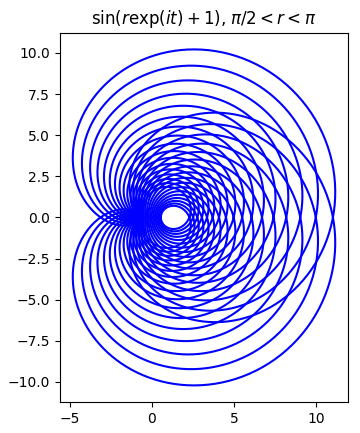
And now for π/2 < r < π.
Here’s the Python code that produced the first plot; the code for the other plots is very similar.
    import matplotlib.pyplot as plt
    from numpy import pi, exp, sin, linspace

    t = linspace(0, 2*pi, 500)

    for r in linspace(0.1, pi/2, 17):
        z = r*exp(1j*t)
        w = sin(z)
        plt.plot(w.real, w.imag, 'b')

    plt.gca().set_aspect("equal")
    plt.title("$\sin(r\exp(it))$, $0 < r < \pi/2$")
    plt.show()