Why 90% solutions may beat 100% solutions

I’ve never written a line of Ruby, but I find Ruby on Rails fascinating. From all reports, the Rails framework lets you develop a website much faster than you could using other tools, provided you can live with its limitations. Rails emphasizes consistency and simplicity, deliberately leaving out support for some contingencies.

I listened to an interview last night with Ruby developer Glenn Vanderburg. Here’s an excerpt that I found insightful.

In the Java world, the APIs and libraries … tend to be extremely thorough in trying to solve the entire problem that they are addressing and [are] somewhat complicated and difficult to use. Rails, in particular, takes exactly the opposite philosophy … Rails tries to solve the 90% of the problem that everybody has and that can be solved with 10% of the code. And it punts on that last 10%. And I think that’s the right decision, because the most complicated, odd, corner cases of these problems tend to be the things that can be solved by the team in a specific and rather simple way for one application. But if you try to solve them in a completely general way that everybody can use, it leads to these really complicated APIs and complicated underpinnings as well.

The point is not to pick on Java. I believe similar remarks apply to Microsoft’s libraries, or the libraries of any organization under pressure to be all things to all people. The Ruby on Rails community is a small, voluntary association that can turn away people who don’t like their way of doing things.

At first it sounds unprofessional to develop a software library does anything less than a thorough solution to the problem it addresses. And in some contexts that is true, though every library has to leave something out. But in other contexts, it makes sense to leave out the edge cases that users can easily handle in their particular context. What is an edge case to a library developer may be bread and butter to a particular set of users. (Of course the library provider should document explicitly just what part of the problem their code does and does not solve.)

Suppose that for some problem you really can write the code that is sufficient for 90% of the user base with 10% of the effort of solving the entire problem. That means a full solution is 10 times more expensive to build than a 90% solution.

Now think about quality. The full solution will have far more bugs. For starters, the extra code required for the full solution will have a higher density of bugs because it deals with trickier problems. Furthermore, it will have far fewer users per line of code — only 10% of the community cares about it in the first place, and of that 10%, they all care about different portions. With fewer users per line of code, this extra code will have more unreported bugs. And when users do report bugs in this code, the bugs will be a lower priority to fix because they impact fewer people.

So in this hypothetical example, the full solution costs an order of magnitude more to develop and has maybe two orders of magnitude more bugs.

Fungus photos

The other day I found these growing at the base of a dead tree in my back yard.

For some reason I don’t understand, people are inclined to see fungi as ugly and something to be removed as soon as possible. That was my first thought, but I decided they were beautiful and that I would enjoy them.

Here’s a close-up.

They were interesting to watch over time. They appeared suddenly after a rain. The flourished for a few days. Then they started to be covered with a white powder. Then they started to shrivel and turn black. A few days later they were gone.

How to calculate correlation accurately

Pearson’s correlation coefficient r is used to measure the linear correlation of one set of data with another. It also provides an example of how you can get in trouble if you just take a formula from a statistics book and naively turn it into a program. I will take two algebraically equivalent equations for the correlation coefficient commonly found in textbooks and give an example where one leads to a correct result and the other leads to an absurd result.

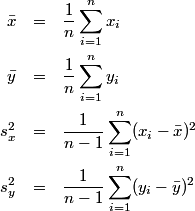
Start with the following definitions.

Lets take a look at two expressions for the correlation coefficient, both commonly given in textbooks.

Expression 1:

r = \frac{1}{n-1} \sum_{i=1}^n \left( \frac{x_i - \bar{x}}{s_x} \right) \left( \frac{y_i - \bar{y}}{s_y} \right)

Expression 2:

r = \frac{\sum_{i=1}^n x_i y_i - n \bar{x} \bar{y}}{(n-1) s_x s_y}

The two expressions for r are algebraically equivalent. However, they can give very different results when implemented in software.

To demonstrate the problem, I first generated two vectors each filled with 1000 standard normal random samples. Both expressions gave correlation 0.0626881. Next I shifted my original samples by adding 100,000,000 to each element. This does not change the correlation, and the program based on the first expression returned 0.0626881 exactly as before. However, the program based on the second expression returned -8.12857.

Not only is a correlation of -8.12857 inaccurate, it’s nonsensical because correlation is always between -1 and 1.

What went wrong? The second expression for r computes a small number as the difference of two very large numbers. The two terms in the numerator are each around 1020 and yet their difference is around 0.06. That means that if calculated to infinite precision, the two terms would agree to 21 significant figures. But a floating point number (technically a double in C) only has 15 or 16 significant figures. That means the subtraction cannot be carried out with any precision on a typical computer.

Don’t draw the conclusion that the second expression is accurate unless it completely fails. The same phenomena that caused a complete loss of accuracy in this example could cause a partial loss of accuracy in another example. The latter could be worse. For example, we might not have suspected a problem if the software had returned 0.10 when the correct value was 0.06.

The same problem comes up over and over again in statistics, such as when computing sample variance or simple regression coefficients. In each case, there are two commonly used formulas, and the formula easier to apply manually is potentially inaccurate. To make matters worse, books sometimes imply that the more accurate formula is only for theoretical use and that the less accurate formula is preferable for computation.

For a more detailed explanation of why the two expressions for correlation coefficient gave such different results when implemented in software, see Theoretical explanation of numerical results.

Peter Drucker and abandoning projects

I’ve been reading Inside Drucker’s Brain, Jeffrey Krames’ book about the late management guru Peter Drucker. The book is not a biography, though it contains some interesting biographical material, but is primarily a summary of Drucker’s ideas.

One thing that stands out is how often Drucker used the word “abandon.” For example, Krames quotes Drucker as follows.

The first step in a growth policy is not to decide where and how to grow. It is to decide what to abandon. In order to grow, a business must have a systematic policy to get rid of the outgrown, the obsolete, the unproductive.

Later he quotes Drucker again saying

It cannot be said often enough that one should not postpone; one abandons.

And again,

Don’t tell me what you’re doing, tell me what you’ve stopped doing.

It can be a tremendous relief to abandon a project. Not just passively neglect it, but actively decide to abandon it.  The practical result is the same — the project doesn’t get done — but deliberate abandonment eliminates guilt and frees up emotional energy. However, abandonment takes courage.

Organizational structure makes it hard for some businesses to ever abandon projects. If a project is killed, the person who kills it takes the heat. But if the project dies of natural causes, another person, someone further down the org chart, may take the blame instead. Under such circumstances, projects are not abandoned often.

If you’re convinced that you need to abandon projects, at least occasionally, how do you know what to abandon and when? Seth Godin wrote a good book on this topic, The Dip. The subtitle is “A Little Book That Teaches You When to Quit (and When to Stick).”

Update: See Johanna Rothman’s discussion Abandoning vs. Killing Projects.

Rate of regularizing English verbs

English verbs form the past tense two ways. Regular verbs ad “ed” to the end of the verb. For example, “work” becomes “worked.” Irregular verbs, sometimes called “strong” verbs, require internal changes to form the past tense. For example, “sing” becomes “sang” and “do” becomes “did.”

Irregular verbs are becoming regularized over time. For example, “help” is now a regular verb, though its past tense was once “holp.” (I’ve heard that you can still occasionally hear someone use archaic forms such as “holp” and “holpen.”)

What I find most interesting about this change quantifying the rate of change. It appears that the half-life of an irregular verb is proportional to the square root of its frequency. Rarely used irregular verbs are most quickly regularized while commonly used irregular verbs are the most resistant to change.

Exceptions have to be constantly reinforced to keep speakers from applying the more general rules. Exceptions that we hear less often get dropped over time. So it’s not surprising that half-life is a decreasing function of frequency. What is surprising is that that half life is such a simple decreasing function, a constant over square root.

Source: Quantifying the evolutionary dynamics of language