I was buying a used book through Amazon this evening. Three resellers offered the book at essentially the same price. Here were their ratings:
- 94% positive out of 85,193 reviews
- 98% positive out of 20,785 reviews
- 99% positive out of 840 reviews
Which reseller is likely to give the best service? Before you assume it’s the seller with the highest percentage of positive reviews, consider the following simpler scenario.
Suppose one reseller has 90 positive reviews out of 100. The other reseller has two reviews, both positive. You could say one has 90% approval and the other has 100% approval, so the one with 100% approval is better. But this doesn’t take into consideration that there’s much more data on one than the other. You can have some confidence that 90% of the first reseller’s customers are satisfied. You don’t really know about the other because you have only two data points.
A Bayesian view of the problem naturally incorporates the amount of data as well as its average. Let θA be the probability of a customer being satisfied with company A‘s service. Let θB be the corresponding probability for company B. Suppose before we see any reviews we think all ratings are equally likely. That is, we start with a uniform prior distribution θA and θB. A uniform distribution is the same as a beta(1, 1) distribution.
After observing 90 positive reviews and 10 negative reviews, our posterior estimate on θA has a beta(91, 11) distribution. After observing 2 positive reviews, our posterior estimate on θB has a beta(3, 1) distribution. The probability that a sample from θA is bigger than a sample from θB is 0.713. That is, there’s a good chance you’d get better service from the reseller with the lower average approval rating.

Now back to our original question. Which of the three resellers is most likely to satisfy a customer?
Assume a uniform prior on θX, θY, and θZ, the probabilities of good service for each reseller. The posterior distributions on these variables have distributions beta(80082, 5113), beta(20370, 417), and beta(833, 9).
These beta distributions have such large parameters that we can approximate them by normal distributions with the same mean and variance. (A beta(a, b) random variable has mean a/(a+b) and variance ab/((a+b)2(a+b+1)).) The variable with the most variance, θZ, has standard deviation 0.003. The other variables have even smaller standard deviation. So the three distributions are highly concentrated at their mean values with practically non-overlapping support. And so a sample from θX or θY is unlikely to be higher than a sample from θZ.
In general, going by averages alone works when you have a lot of customer reviews. But when you have a small number of reviews, going by averages alone could be misleading.
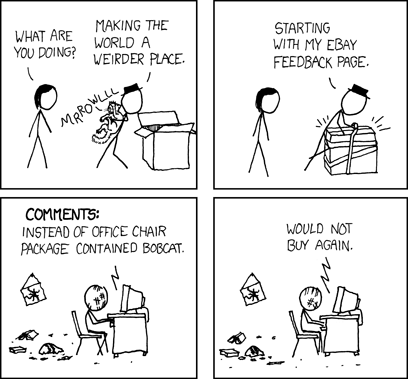
Thanks to Charles McCreary for suggesting the xkcd comic.
Pleasure visiting with you at SciPy, but this post demands a link:
http://xkcd.com/325/
The xkcd strip is perfect! Thanks. I updated the post to include it.
Correct me if I’m wrong, but the comic isn’t entirely apt given the subject matter: Hat guy (that’s what the character is semi-officially called) can keep a respectable positive review ratio regardless of how many people he ships to as long as he keeps sending the same ratio of bobcats to office chairs. That means someone applying your methods could well end up with a supremely angry bobcat instead of a somewhat sub-par chair that took a while to arrive, simply because Hat Guy and Semi-Loser Chair Salesman looked the same in the model.
Of course, your model works well in the real world because Seller A through Seller Z really are pretty much the same if your model says they look similar. Applying it to restaurants gets messier, however, as you have to consider price points (McDonald’s probably gets better ratings than a sub-par $20-a-plate bistro) and the fact that if you go to a sufficiently bad restaurant your health is on the line.
Finally, you have to assume people know what quality means. With chairs it’s easy, with food it’s mostly personal preference once you leave salmonella-land, but with physicians and college professors the ‘clients’ are, almost by definition, unable to judge what they’re getting with any kind of expertise.
Chris: The model applies better to sports. Suppose Michael has made 80 of his last 100 free throw attempts. Larry has made 2 out of 2 free throws. Who is the better player? Larry has the better average, but I’d bet on Michael, given only that information.
But if I knew, for example, that Michael and Larry were professional basketball players, I would not start with a uniform prior. I’d start with a fairly informative prior that puts a lot of probability around whatever the average free throw percentage is for professional basketball players. That could change the bet of which is the better player.
I have had the same question when I tried to buy staff from amazon. I like your idea.
Pics, or it didn’t happen:
Beta(3,1) PDF & CDF
http://www.wolframalpha.com/input/?i=beta+distribution+with+alpha%3D3+and+beta%3D1#
Beta(91,11) PDF & CDF
http://www.wolframalpha.com/input/?_=1317191370801&fp=1&i=beta+distribution+with+alpha%3d91+and+beta%3d11&incTime=true#
John – Am completely clueless about statistics but thanks for illustrating the why and the how behind judging information, that too with a relatable example. Appreciate it!
I feel like this could turn into an App. Not only for Amazon — for Elance, Odesk, or any site with user ratings.
The company’s Sort should be working with a functional … and you’ve just suggested a good one. (A different prior could be used for ratings that come from untrustworthy users.)
The main problem with such a bayesian argument that I see is the Beta(1,1) prior. I think I would choose different, larger paramaters, based on how often someone with no feedback is likely to have bad service.
1) It’s not true that you expect service quality to be randomly distributed from 0 to 1 for a new seller. You would want to look at the average quality of new sellers in the past. I have no data other than my own experience as a frequent user of ebay and amazon since 1998, but I would guess it would be more like around 0.9, which changes the math considerably – enough that the seller with the highest percentage score is the way to bet unless he has very little feedback.
2) It’s kind of weird to illustrate your point with an example in which your idea doesn’t apply. Clearly you need feedback numbers well below 800 before this issue is worth thinking about.
The post would have been better if it had given some idea of how little feedback a seller should have before you worry about it.
I still didn’t catch the answer to your question “Which of the three resellers is most likely to satisfy a customer?”. So which is it now? None of them?
Josh: It turns out in the first example that the reseller with the highest average is also most likely to satisfy customers.
human mathematics: There’s an app for that, or at least a very good head start. The Inequality Calculator that I liked to calculates these kinds of inequalities, and it draws pictures. It plots the two density curves on top of each other so it’s easier to compare them. Calculating beta inequalities is numerically tricky, but the other two links explain how it can be done.
I added an image based on your suggestion. I first used the image from Inequality Calculator, but the image above from Sage scaled better so I posted it instead.
I think the analysis fails to take one thing into account (which may or may not be able to be taken into account). That is, the amount of time that the entity being reviewed has been receiving reviews. In the example, how are the values skewed if the entity with 100 reviews has been around receiving reviews for five year and the one with two reviews has been around receiving reviews for one week?
John,
Very nice post. The comment about the choice of prior other than beta(1,1) actually makes (indirectly) the very salient point that the prior is YOUR prior beliefs, and you’re welcome to use your prior beliefs quantified rather than a nice conjugate prior. One of the beauties of the Bayesian way.
Many people get caught up in the average value rather than in what went into the average. Just as, many people and the press get swayed into reporting results from small observational or clinical trials as the truth, not understanding that the number of subjects and the variability is what’s important to assess the result’s importance.
c23: Regarding your first point, how do you know what I expect? :) You seem to know more about online resellers, so you have more information and a different distribution on the probability of good service. That’s as it should be. But regardless of what I personally expect, a uniform distribution makes the example simple.
People (on Reddit and HN) are hung up on the prior. In the limit (of data points) would the posteriors always converge to the same distribution?
It seems that this doesn’t take into account the act of creating fake reviews, it’s easier to create a few hundred fake reviews than 10 000. There should be some penalty in this regard, where we assume that some fixed number of positive reviews are fake.
What would be the standard non-Bayesian approach? Would it lead to a different conclusion? My intuition about such things is that if the Bayesian and Classical analyses lead to different conclusions, you probably need more data. If you really need to reach a decision now, or for some other reason can’t collect more data, then pick your poison.
It seems to me that in the limit (of data points) each posterior should converge to a Dirac-delta centered at the true rate.
Nice idea. You might also take into account that these are not random draws — there’s potentially strategic behavior, maybe on both sides. Here’s an example of how that might work:
http://luiscabral.org/economics/publications/JIE%202010.pdf
And yet another xkcd link about average ratings: http://xkcd.com/937/
Is it possibile to calculate the inequality with R?
It would be interesting to see the frequentist approach to solve the same problem.
Alessandro: The last two links on the page point to technical reports that will tell you how to implement the inequality calculation.
This is always an interesting problem, caused mostly by small sample size. It reminds me of this recent comic, not about average ratings but about sample size problem
http://romancemath.blogspot.com/2011/10/12-casanova.html
Using this logic, it is hard to attract customers when you first start selling: even if all your reviews are positive, people prefer the more established sellers. The only way to compete is to offer more, ie., cheaper shipping, lower price. By the same token, if you are an established seller, you can hike up your price and don’t have to worry about losing customers.
Excuse me, what is the formula to calculate that “The probability that a sample from θA is bigger than a sample from θB is 0.713.”
Hannah: See the “related links” at the bottom of the post. There’s no simple formula for the probability. But the first link is to software that can calculate it, the third explains how to compute the probability analytically for special values of the parameters, and the second explains how to compute the probability numerically in general.
A python module for the calculation of P(X>Y) would be great …
It takes a while to make connections…here’s another method for ‘judging’ binary voting, using ratio -and- n: http://www.evanmiller.org/how-not-to-sort-by-average-rating.html
So, I love overanalyzing problems as much as the next guy. (No, really, I wrote a series of three or four essays solving elementary-school arithmetic problems through finite set theory, complete with theorems such as “subtraction is possible.”) But isn’t this specific question more easily answered by the rule of succession?
Pr(success) = (successes + 1) / (trials + 2)
If we define a success as a a review here, we get respective probabilities of about 94%, 98%, and 99%, and conclude that Seller 3 is optimal, which of course agrees with your analysis since both are presumably correct.
Compare to your second example, where the guy with 100 reviews scores about 89% under the rule of succession, while the guy with only two reviews scores 75%.
I’ve never really read up on beta distributions, but if they are what they appear to be from your description, it ought to be the case that E(Beta(m,n)) = m/(m+n). And checking Wikipedia now, I see that of course this is true. Which means that, entirely by accident, I have now learned what beta distributions actually are, and can officially say I’ve learned something from your post. Thanks!
John: Any ideas on what one can do if not all the transactions were rated? The silent transactions are a mixture of positives and negatives. These are particularly important for popular goods or sellers, since people appear reluctant to review McDonald’s on sites like Yelp.
What would be wrong (or at least problematic) with calculating confidence intervals for each proportion?
*****
Sample X N Sample p 95% CI
1 80081 85193 0.939995 (0.938379, 0.941581)
Sample X N Sample p 95% CI
1 20369 20785 0.979986 (0.977989, 0.981846)
Sample X N Sample p 95% CI
1 832 840 0.990476 (0.981321, 0.995880)
great article
“The probability that a sample from θA is bigger than a sample from θB is 0.713.”
how did you calculate it?
Anna Powell Smith did something on this.
https://anna.ps/blog/statistics-find-nicest-food-at-waitrose
Nice post! Is it also useful to look at the fraction itself and not only to the percentage. So we focus or give importance also to the denominator not only to the rate between numerator and denominator. The fractions in your short example are:
-90/100 and 2/2
So the denominator of the second is 50 times lesser than the first one and as a number is small, n<100. We suspect that may have a bigger enough variance to not trust them enough.
Also to add one negative rate to the rates itself is very useful. In those cases: 90/101 (89%) and 2/3 (66%). So definitely the second is worst.