Probability is full of theorems that say that probability density approximates another as some parameter becomes large. All the dashed lines in the diagram below indicate a relationship like this.
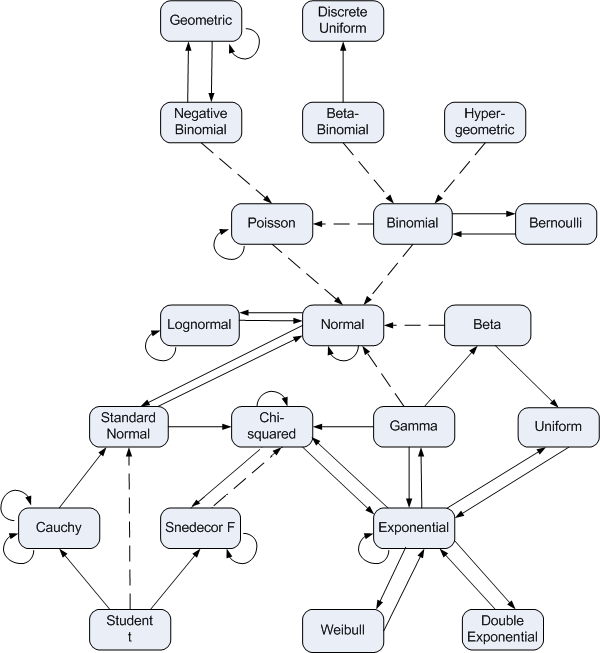
You can find details of what everything in the diagram means here.
How can you quantify these approximations? One way is to use Kullback-Leibler divergence. In this post I’ll illustrate this for the normal approximation to the beta and gamma distributions.
The Kullback-Leibler divergence between two random variables X and Y is defined as
![]()
We will compute this integral numerically in the code below to create graphs of how K-L divergence varies with parameters.
Here are the imports we’ll need.
    from scipy.integrate import quad
    from scipy.stats import beta, gamma, norm
    from scipy import inf
    import matplotlib.pyplot as plt
Beta distribution
As the shape parameters of a beta distribution become large, the probability distribution becomes approximately normal (Gaussian).
Here is code that will take the two shape parameters of a beta distribution, construct a normal approximation by moment matching, and compute the quality of the approximation as measured by Kullback-Leibler divergence.
    def KL_beta_norm(a, b):
        b = beta(a, b)
        n = norm(b.mean(), b.std())
        f = lambda x: -b.pdf(x)*(n.logpdf(x) - b.logpdf(x))
        integral, error = quad(f, 0, 1)
        return integral
And here we make our plot.
    x = [2**i for i in range(11)]
    y = [KL_beta_norm(t, 2*t) for t in x]
    plt.plot(x, y)
    plt.xscale("log")
    plt.yscale("log")
    plt.xlabel("a")
    plt.ylabel("KL divergence")
    plt.title("Comparing beta(a, 2a) and its normal approximation")
    plt.savefig("beta_KL.svg")
    plt.close()
The result is nearly linear on a log-log scale.

I made the b parameter twice the a parameter to show that you don’t need symmetry. When you do have symmetry, i.e a = b, the approximation quality is better and the graph is even straighter.
Gamma distribution
As the shape parameter of a gamma distribution increases, the probability density becomes more and more like that of a normal distribution. We can quantify this with the following code.
    def KL_gamma_norm(shape):
        g = gamma(shape)
        n = norm(g.mean(), g.std())
        f = lambda x: -g.pdf(x)*(n.logpdf(x) - g.logpdf(x))
        mode = max(0, shape-1)
        integral1, error1 = quad(f, 0, mode)
        integral2, error2 = quad(f, mode, inf)
        return integral1 + integral2
The integration code is a little more complicated this time. For small shape parameters, code analogous to that for the beta distribution will work just fine. But for larger parameters, the integration fails. The numerical integration routine needs a little help. The largest contribution to the integral is located near the mode of the gamma distribution. For large shape parameters, the integration routine misses this peak and grossly underestimates the integral. We break the integral into two pieces at the mode of the gamma distribution so the integration routine can’t miss it. This is a small example of why numerical integration cannot be completely automated. You have to know something about what you’re integrating.
(The quad() function has a parameter points to let you tell it about points of interest like this, but it doesn’t work when one of the limits of integration is infinite.)
The plotting code is essentially the same as that for the beta distribution. As before, the plot is linear on a log-log scale.

You could do a similar analysis on the other approximations in the distribution relationship diagram above.
More probability distribution approximation posts
- Details for error bound on normal approximation to the Poisson distribution
- Error in the normal approximation to the beta distribution
- Error in the normal approximation to the binomial distribution
- Error in the normal approximation to the gamma distribution
- Error in the normal approximation to the Poisson distribution
- Error in the normal approximation to the t distribution
- Error in the Poisson approximation to the binomial distribution
Cool topic, I wonder if we can relate KL divergence to moment deviations, at least for some classes of distribution? E.g. the difference in kurtosis can be easily quite large, so in an overall equation for KL approx I expect a smaller weight for it than for skew or stddev.