Last night a friend from Vanderbilt, Father John Rickert, sent me a curious math problem. (John was a PhD student in the math department while I was a postdoc. He went on to become a Catholic priest after graduating.) He said that if you look at iterates of
f(x) = exp( sin(x) )
the plots become square.
Here’s a plot to start the discussion, looking at f(x), f(f(x)), f(f(f(x))), and f(f(f(f(x)))).
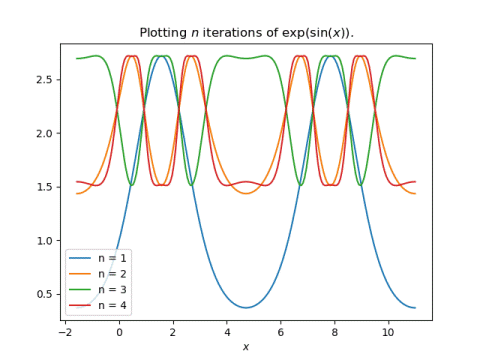
One thing that is apparent is that there’s a big difference between applying f once and applying it at least two times. The former can range between 1/e and e, but the latter must be between exp(1/e) and e.
The plots overlap in a way that’s hard to understand, so let’s spread them out, plotting one iteration at a time.
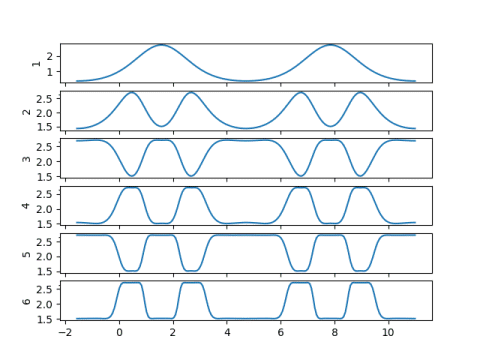
Now we can see the plots becoming flatter as the number of iterations increases. We can also see that even and odd iterations are roughly mirror images of each other. This suggests we should make a plot of at just even or just odd iterates. Here we go:
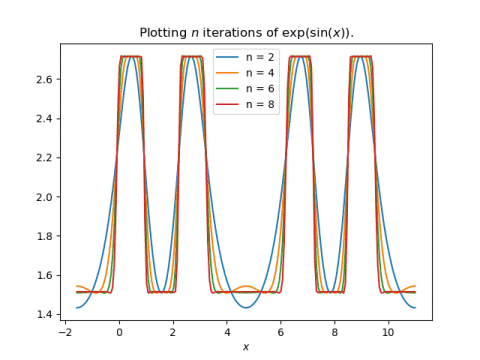
This shows more clearly how the plots are squaring off pretty quickly as the number of iterations increases.
My first thought when John showed me his plot was that it must have something to do with the contraction mapping theorem. And I suppose it does, but not in a simple way. The function f(x) is not a contraction mapping for any x. But f(f(x)) is a contraction mapping for some x, and further iterates are contractions for more values of x.
Update: See the next post calculates the fixed points of f(f(x)) and demonstrates how the stable fixed points converge and the unstable fixed point does not.
My second thought was that it would be interesting to look at the Fourier transform of these iterates. For any finite number of iterations, the result is a periodic, analytic function, and so eventually the Fourier coefficients must go to zero rapidly. But I suspect they initially go to zero slowly, like those of a square wave would. I intend to update this post after I’ve had a chance to look at the Fourier coefficients.
Update: As expected, the Fourier coefficients decay slowly. I plotted the Fourier sine coefficients for f(f(f(f(x)))) using Mathematica.
    f[x_] := Exp[Sin[x]]
    g[x_] := f[f[f[f[x]]]]
    ListPlot[ Table[
        NFourierSinCoefficient[g[x], x, i],
        {i, 30}]
    ]
This produced the plot below.
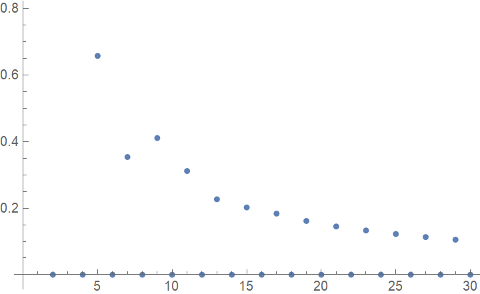
The even-numbered coefficients are zero, but the odd-numbered coefficients are going to zero very slowly. Since the function g(x) is infinitely differentiable, for any k you can go far enough out in the Fourier series that the coefficients go to zero faster than n−k. But initially the Fourier coefficients decay like 1/n, which is typical of a discontinuous function, like a square wave, rather than an infinitely differentiable function.
By the way, if you replace sine with cosine, you get similar plots, but with half as many flat spots per period.
If you plot y=f(f(x)) and y=x, you can see that there are two stable fixed points, with one unstable fixed point in between.
And similarly for exp(cos(exp(cos(x)))).
Dr.Cook, I think the iteration function’s range is a little different:
f(x) between 1/e and e
f(f(x)) between e^(sin1/e) and e
f(f(f(x))) and the latter between e^(sine) and e