I recently noticed something in a book I’ve had for five years: the bibliography section ends with a histogram of publication dates for references. I’ve used the book over the last few years, but maybe I haven’t needed to look at the bibliography before.
This is taken from Bernstein’s Matrix Mathematics. I wrote a review of it here.
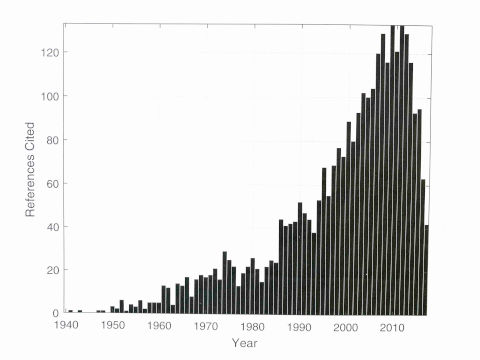
An up-to-date bibliography isn’t always necessary. One of the references I use the most is nearly 60 years old, and another book I pull down occasionally is 100 years old. But sometimes you do need a current reference, and a histogram of publication dates is a good way for the author to demonstrate that the references are up to date.
By the way, notice the phantom diagonal lines across the histogram? That’s a moiré.[1]
***
The growth in citations, in this plot, looks roughly linear. The growth in citations for my Evidence based software engineering book are exponential https://shape-of-code.com/2020/01/12/the-dark-age-of-software-engineering-research-some-evidence/ . The plot in the 7th edition of “Cognitive Psychology and its implications” by J Anderson, published in 2010, peaks around 1985, and is a none peaky Normal distribution.
Does Anderson’s 1985 peak reflect a particularly active time for the field, or the time when he had the time to do lots of reading before becoming a busy professor?
Does the exponential growth in my book reflect a rapidly growing field, or the rapid irrelevance of papers with time (I thinkt he former)?
Does the Bernstein plot reflect a growing field, or him being more likely to remember more recent papers?
I wish more authors would produce these plots. They are an indications of what they have read, and how upto date the book might be.