I owe Microsoft Word an apology

I tried to use the Equation Editor in Microsoft Word years ago and hated it. It was hard to use and produced ugly output. I tried it again recently and was pleasantly surprised. I’m using Word 2007. I don’t remember what version I’d tried before.

I’ve long said that math written in Word is ugly, and it usually is. But the fault lies with users, like myself, not with Word. I realize now that the problem is that most people writing math in Word are not using the Equation Editor. LaTeX produces ugly math too when people do not use it correctly, though this happens less often.

Math typography is subtle. For example, mathematical symbols are set in an italic font that is not quite the same as the italic font used in prose. Also, word-like symbols such as “log” or “cos” are not set in italics. I imagine most people do not consciously notice these conventions — I never noticed until I learned to use LaTeX — but subconsciously notice when the conventions are violated. The conventions of math typography give clues that help readers distinguish, for example, the English indefinite article “a” from a variable named “a” and to distinguish the symbol for maximum from the product of variables “m”, “a”, and “x.”

Microsoft’s Equation Editor typesets math correctly. Word documents usually do not, but only because folks usually do not use the Equation Editor. In the following example, I set the same equation three times: using ordinary text, using ordinary italic for the “x”, and finally using the Equation Editor.

screen shot of trig identity using MS Word

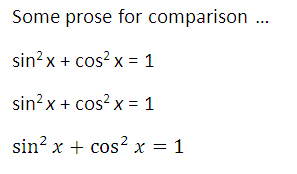
Note that the “x” in the third version is not the same as the italic “x” in the second version. The prose in this example is set in Calibri font and the Equation Editor uses Cambria Math font. Also, I did not tell Word to format “sin” and “cos” one way and “x” another or tell it what font to use; I simply typed sin^2 x + cos^2 x = 1 into the Equation Editor and it formatted the result as above. I haven’t used it much, but the Equation Editor seems to be more capable and easier to use than I thought.

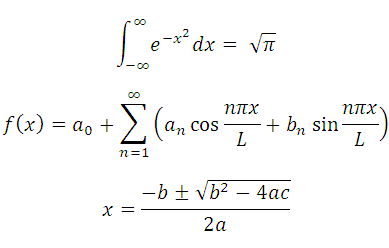
Here are a few more examples of Equation Editor output.

examples of math using Word: Gaussian integral, Fourier series, quadratic equation

I still prefer using LaTeX for documents containing math symbols. I’ve used LaTeX for many years and I can typeset equations very quickly using it. But I’m glad to know that Word can typeset equations well and that the process is easier than I thought.

I tried out the Equation Editor because Bob Matthews suggested I try MathType, a third-party equation editor add-on for Microsoft Word. I haven’t tried MathType yet but from what I hear it produces even better output.

Related post: Contrasting Microsoft Word and LaTeX

Create offline, analyze online

Sitting at a computer changes the way you think. You need to know when to walk away from the computer and when to come back.

I think mind mapping software is a bad idea. Mind maps are supposed to capture free associations. But the very act of sitting down at a computer puts you in an analytical frame of mind. In other words, mind mapping is a right-brain activity, but sitting at a computer encourages left-brain thinking. Mind mapping software might be a good way to digitize a map after you’ve created it on paper, but I don’t think it’s a good way to create a map.

When I need to sort out projects and priorities, I do it on paper. After that I may type up the results. I like to capture ideas on paper or on my voice recorder but then store them online.

When I do math, I scribble on paper, then type up my results in LaTeX. Scribbling helps me generate ideas; LaTeX helps me find errors. I’ve found that fairly short cycles of scribbling and typing work best for me, a few cycles a day.

In the past, we did a lot of things on paper because we had no choice. Today we do a lot of things on computers today just because we can. It’s going to take a while to sift through the new options and decide which ones are worthwhile and which are not.

Recommended books

Daniel Pink’s book A Whole New Mind has a good discussion of left-brain versus right-brain thinking. As he points out, the specialization between the left and right hemispheres of the brain is more complicated than once thought. However, the terms “left-brain” and “right-brain” are still useful metaphors even if they’re not precise neuroscience.

Also, to read more on how computers influence our thinking, see Andy Hunt’s book Pragmatic Thinking and Learning.

Related posts

Typesetting music with LilyPond

I tried typesetting music in LaTeX some time ago and gave up. The packages I found were hard to install, the examples didn’t work, etc. This weekend I decided to try again. I tried plowing through the MusiXTeX documentation and got no further than I did last time.

I posted a note on StackOverflow and got some good responses. Nikhil Chelliah suggested I look at LilyPond. I had looked at LilyPond before, and @jleedev explained how to integrate LaTeX and LilyPond.

Here’s some sheet music I included in my previous post, March in 7/4 time.

sheet music example

Here’s a full-sized PDF file version of the music above. And here’s the LilyPond source code used to create the music.

\relative c' {
\time 7/4
\key f \major
\clef treble
f g f \times 2/3{ c8 c c} f4 g a
g a8. bes16 a4 g f g c,
f g f \times 2/3{ c8 c c} f4 g a
g a8. bes16 a4 g f e f
}

The notation looks cryptic at first, but it makes sense after a few minutes. The command relative c' means that the following pitches will be relative to middle C. For example, the first note, F, is the F closest to middle C. Each note is the same length as the previous note by default, and the first note is a quarter note by default. The notation c8 means that the C is an eighth note, except it’s in the context of a triplet (times 2/3) and so it’s an eighth note triplet. The next F is denoted f4 to indicate that we’re back to quarter notes.

The notation a8. says that the A is a dotted eighth note. For the next note, bes16 means a B-flat sixteenth note. The suffix “es” stands for “flat” and “is” stands for “sharp.” (The documentation says it’s Dutch. I’ve never seen it before.) I don’t understand why I had to tell it that the B was flat. The code specified earlier that the key was F major, which implies B’s are flat. I suppose the code for individual notes is decoupled from the code to draw the key signature. That would make entering music painful in keys that have lots of sharps or flats. Maybe there’s a way to specify default sharps or flats.

The comma in c, gives the absolute pitch of the C. In relative mode, LilyPond assumes by default that each pitch name refers to the pitch closest to its predecessor. The C closest to the previous note, F, would have been the C up one fourth rather than down one fifth, so the comma was necessary to tell LilyPond to go down.

If I were to do a lot of music processing, I’d probably look at a commercial package such as Sibelius. But for now I’m just interested in producing small excerpts like that above, and it looks like LilyPond may be fine.

Update: I double checked the rules about flats etc. Yes, I do have to specify explicitly that the B in this example is B-flat. If I just say b rather than bes, LilyPond will add a natural sign in front of the B! It’s strange. It is aware of the key signature: when I tell it the B is flat, it says “OK, then I don’t have to mark that specially since it’s implicit in the key signature.” And if I don’t tell it the B is flat, it says “Oh, that’s an exception to the key signature. Better mark it with a natural sign.”

How to display side-by-side figures in LaTeX

The other day I tried putting two graphs side-by-side by setting R’s mfrow parameter. That made the graphs look odd because not everything was scaled proportionately. Then someone told me I could use a LaTeX command to place my original graphs side-by-side rather than creating a new image.

The trick is to use the subfigure package. Include the directive usepackage{subfigure} at the top of your file, then use code something like the following.

\begin{figure}
\centering
\mbox{\subfigure{\includegraphics[width=3in]{fig1.pdf}}\quad
\subfigure{\includegraphics[width=3in]{fig2.pdf} }}
\caption{Text pertaining to both graphs ...} \label{fig12}
end{figure}

If you put text in square brackets immediately after the \subfigure command, that text will be a caption for the corresponding sub-figure. For example, the LaTeX code above might be changed to include the following.

...\subfigure[Description of left graph]{\includegraphics...

Why is TeX so popular in Germany?

A lot of good (La)TeX resources come from Germany. I assume from the amount of development and support activity, there are probably a lot of users as well. Does anyone know why TeX is apparently so strong in Germany? Is there something about the German language that TeX supports particularly well?

How to put PDF properties in a LaTeX file

My previous post described how to put links in a PDF file generated from LaTeX. The hyperref package that lets you include links also lets you to set PDF document properties. I’ve been using Adobe Acrobat to do this after creating my PDF file with pdflatex, but that’s unnecessary. Here’s how to put the PDF properties directly in the LaTeX file. Add something like this

\hypersetup
{
    pdfauthor={John Hancock},
    pdfsubject={Some subject},
    pdftitle={Sample document},
    pdfkeywords={LaTeX, PDF, hyperlinks}
}

after the \usepackage{hyperref} instruction at the top of your file.

How to link to web pages from LaTeX-generated PDF

This has been on my to-do list for a while, but I finally found out how to embed hyperlinks in a PDF file generated from LaTeX.

Short answer: put \usepackage{hyperref} in your header, and when you want to link to a page, use the command \href{URL}{anchor text}. For example,

\documentclass{article}
\usepackage{hyperref}
\begin{document}

Here's a link to \href{http://twitter.com/home}{Twitter}.

\end{document}

For much more detail on links in LaTeX documents, see Patrick Jöckel’s LaTeX-PDF page and the hyperref package documentation. [Update: looks like these links went away.]

Watch what you name graphics files in LaTeX

A while back I was trying to paste a figures into a LaTeX document this evening with names like foo_27.png and foo_32.2.png, putting a parameter value into the name of the plot. The former worked but the latter didn’t.

It turns out the \includegraphics command parses the file extension in a naive way to determine the file type. When it sees foo_27.png, it says “OK, a .png file”. But when it sees foo_32.2.png, it says “.2.png? I’ve never heard of that file type.”

Related post: Including graphics in LaTeX documents

Four ways to convert Excel tables to LaTeX

Gregor Gorjanc has a post on Excel and LaTeX that lists four ways to convert and Excel table into LaTeX. I’ve used two of the methods he lists: brute force and excel2latex. I recommend excel2latex. I used it frequently until I upgraded to Office 2007 and the plug-in quit working. The only bug I remember with it was that sometimes it would give you a warning saying it didn’t work, but it did; the LaTeX code you wanted was waiting for you on the Windows clipboard.

I plan to try out Gregor’s other two suggestions. Creating tables in Excel is far easier than doing so in LaTeX and I miss the functionality that excel2latex provided. Maybe there’s a way to use excel2latex with Excel 2007. If you know of a way, please leave a comment.

Including images in LaTeX files

Here are the rules for including images in LaTeX files as far as I can tell.

Near the top of your document, use \usepackage{graphicx} to load the graphicx package. Then at the point where you want to include your image, use \includeimage{...} where … is the path to your file.

If you want to create a PDF file with pdflatex, your image must be in PDF, PNG, or JPEG format.

If you want to create a DVI file with latex or a PS file with dvips, your image must be in PS or EPS format.

There’s no way to include a GIF file without first converting it to another file format.

If you use \usepackage{pgf} rather than  \usepackage{graphics} at the top of the file, nothing changes except that you must chop the file extensions off image file names.

Related post: Watch what you name graphics files in LaTeX