Four ways to convert Excel tables to LaTeX

Gregor Gorjanc has a post on Excel and LaTeX that lists four ways to convert and Excel table into LaTeX. I’ve used two of the methods he lists: brute force and excel2latex. I recommend excel2latex. I used it frequently until I upgraded to Office 2007 and the plug-in quit working. The only bug I remember with it was that sometimes it would give you a warning saying it didn’t work, but it did; the LaTeX code you wanted was waiting for you on the Windows clipboard.

I plan to try out Gregor’s other two suggestions. Creating tables in Excel is far easier than doing so in LaTeX and I miss the functionality that excel2latex provided. Maybe there’s a way to use excel2latex with Excel 2007. If you know of a way, please leave a comment.

Finding distances using latitude and longitude

compass

I posted a page this evening that lets you calculate the distance between two locations using their latitudes and longitudes. I’ve had to do this calculation once in a while and thought I’d make it available online for anyone else who needed to do the same. There is one page providing an online calculator and another page giving the formula used to calculate the distances and its derivation.

This project was prompted by a friend asking me how far my home is from Galveston where the hurricane is supposed to make landfall this weekend. Since we live northwest of Houston, we’re pretty far inland.

Related posts

Binomial coefficients

The simplest definition of binomial coefficients is given by

{n \choose k} = \frac{n!}{k! (n-k)!}

where n is a positive integer and 0 ≤ kn. There are two generalizations of this definition. The first is to let n be any real number. Then the binomial coefficient (r, k) can be defined as

more general definition

where

falling power definition

is the kth falling power of r. This definition is adequate for most applications.

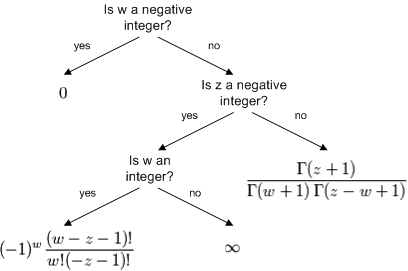
The final generalization is to let z and w be any complex numbers and define the binomial coefficient (z, w) as

binomial coefficient as limit of gammas

This generalization is more complicated, but in some sense it is more natural. Essentially it uses the simplest definition and replaces n! with Γ(n+1). However, the business of the limits is subtle and important.

For motivation of these definitions and details regarding how they work, see the article Binomial coefficients.

Drug looks promising, come back in 30 years

The most recent 60-Second Science podcast summarizes a paper in Science magazine reporting that the average interval between a drug being deemed “promising” and the first paper appearing showing clinical effectiveness is 24 years.

Note that the publication of a paper saying a drug is clinically effective is a far cry from regulatory approval. Many new drugs that look like an improvement after a phase II trial turn out to be no better than existing treatments, and those really are better take years to achieve regulatory approval.

* * *

Consulting in clinical trial design

How to treat a stingray wound

This afternoon, my family and I were wading on the shores of the Gulf of Mexico off Galveston Island. A stingray cut one of my daughters on her foot. When I took her somewhere for help, the main thing they did was to put her foot in a pan of hot water. It only takes about 30 seconds for the heat from the water to bring relief by neutralizing the toxin from the stingray. You have to keep soaking a while longer or else the pain will come right back. The nurse said that a chemical hotpad makes a good treatment if you can’t get to hot water and that the same treatment is effective for other common stings in this area.

My daughter is fine now. The hot water and a topical antibiotic were all she needed.

Random inequalities VII: three or more variables

The previous posts in this series have looked at P(X > Y), the probability that a sample from a random variable X is greater than a sample from an independent random variable Y. In applications, X and Y have different distributions but come from the same distribution family.

Sometimes applications require computing P(X > max(Y, Z)). For example, an adaptively randomized trial of three treatments may be designed to assign a treatment with probability equal to the probability that that treatment has the best response. In a trial with a binary outcome, the variables X, Y, and Z may be beta random variables representing the probability of response. In a trial with a time-to-event outcome, the variables might be gamma random variables representing survival time.

Sometimes we’re interested in the opposite inequality, P(X < min(Y,Z)). This would be the case if we thought in terms of failures rather than responses, or wanted to minimize the time to a desirable event rather than maximizing the time to an undesirable event.

The maximum and minimum inequalities are related by the following equation:

P(X < min(Y,Z)) = P(X > max(Y, Z)) + 1 – P(X > Y) – P(X > Z).

These inequalities are used for safety monitoring rules as well as to determine randomization probabilities. In a trial seeking to maximize responses, a treatment arm X might be dropped if P(X > max(Y,Z)) becomes too small.

In principle one could design an adaptively randomized trial with n treatment arms for any n ≥ 2 based on P(X1 > max(X2, …, Xn)). In practice, the most common value of n by far is 2. Sometimes n is 3. I’m not familiar with an adaptively randomized trial with more than three arms. I’ve heard of an adaptively randomized trial that was designed with five arms, but I don’t believe the trial ran.

Computing P(X1 > max(X2, …, Xn)) by numerical integration becomes more difficult as n increases. For large n, simulation may be more efficient than integration. Computing P(X1 > max(X2, …, Xn)) for gamma random variables with n=3 was unacceptably slow in a previous version of our adaptive randomization software. The search for a faster algorithm lead to this paper: Numerical Evaluation of Gamma Inequalities.

Previous posts on random inequalities: