Suppose you want to color a map with no two bordering regions having the same color. If this is a map on a plane, you can do this using only four colors, but maybe you’d like to use more.
You can reduce the problem to coloring the nodes in a graph. Each node corresponds to a region, and there is an edge between two nodes if and only if their corresponding regions share a border.
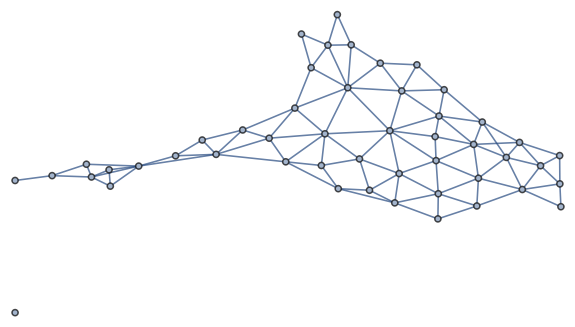
Here is a sort of topologists’s or graph theorist’s view of the continental United States.
This was created using the following sample code from the Mathematica documentation.
    RelationGraph[MemberQ[#2["BorderingStates"], #1] &,
        EntityList[
            EntityClass["AdministrativeDivision", "ContinentalUSStates"]]]
You can recognize Maine in the graph because it’s the only state that only borders one other state. Alaska is also easy to locate. Exercise for the reader: mentally add Hawaii to the graph.
The analogous graph for Texas counties took much longer to draw: there are 49 continental US states but 254 Texas counties.

This was created with the following code.
    RelationGraph[MemberQ[#2["BorderingCounties"], #1] &,
        EntityList[EntityClass["AdministrativeDivision", "USCountiesTexas"]]]
You can find El Paso county in the top left; it only borders one county just as Maine only borders one state.
Am I wrong, or is the fifth vertex from the left right near where two edges cross, and the crossing would go away if that vertex was just scooched down a bit? Odd, as all the rest of the graph is nicely untangled.