One diagram, two completely different meanings

I was thumbing through a new book on causal inference, The Effect by Nick Huntington-Klein, and the following diagram caught my eye.

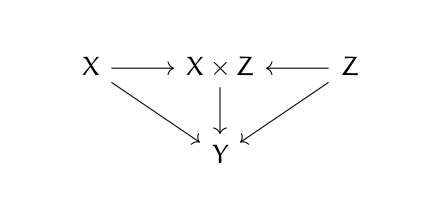
Then it made my head hurt. It looks like a category theory diagram. What’s that doing in a book on causal inference? And if it is a category theory diagram, something’s wrong. Either there’s a typo or the arrows are backward.

The diagram above is a valid commutative diagram, but for a coproduct rather than a product. That is, X × Z should be labeled X ⨿ Z. (For more on that, see my post on categorical products, and reverse all the arrows in your mind.)

But there’s no category theory going on here. This is an influence diagram. It says that X and Z influence Y directly (indicated by the diagonal arrows), but they also determine the product X × Z (the ordinary product of two numbers, no fancy category stuff) and this product in turn also influences Y.

Related posts

Does gaining weight make you taller?

In his autobiography, The Pleasures of Statistics, Frederick Mosteller gives an amusing example of why observational studies are no substitute for doing experiments.

We are all familiar with the idea that we can estimate height in male adults from their weight. … But not one of us believes that adding 20 pounds by eating and minimizing exercise will add an inch to our height.

The problem is not simply that the direction of causality backward, it’s that we cannot use a static description to predict what will happen if we change something.

Although regression situations may give one the illusion of finding out what would happen if we changed something, in the absence of an experiment they offer merely offer guesses.

He summarizes his point by quoting George Box:

To find out what happens to a system when you interfere with it, you have to interfere with it (and not just passively observe it).

Remember this next time you hear claims such as every dollar spent on X saves so many dollars spent on Y. Or every minute spent exercising increases your life expectancy by so many minutes. Or every time you do some activity you increase or decrease your risk of cancer by so much. First of all, these kinds of statements are linear extrapolations on situations that are not linear. Second, they may be observations that do not describe what will happen when you change something. They may be no more true than the idea that gaining weight makes you taller.

Here’s an example of how observation and intervention differ. Lottery winners often go bankrupt within a couple years of receiving their prize. If you suddenly make someone a millionaire, they’re not a typical millionaire.

Related posts