The academic cocoon

In the novel Enchantment, the main character, Ivan, gives a bitter assessment of his choice of an academic career, saying it was for “men who hadn’t yet grown up.”

The life he had chosen was a cocoon. Surrounded by a web of old manuscripts and scholarly papers, he would achieve tenure, publish frequently, teach a group of carefully selected graduate students, be treated like a celebrity by the handful of people who had the faintest idea who he was, and go to his grave deluded into thinking he had achieved greatness when in fact he stayed in school all his life. Where was the plunge into the unknown?

I don’t believe the author meant to imply that an academic career is necessarily so insular. In the context of the quote, Ivan says his father, also a scholar, “hadn’t stayed in the cocoon” but had taken great risks. But there is certainly the danger of living in a tiny world and believing that you’re living in a much larger world. Others may face the same danger, though it seems particularly acute for academics.

It’s interesting that Ivan criticizes scholars for avoiding the unknown. Scholars would say they’re all about pursuing the unknown. But scholars pursue known unknowns, questions that can be precisely formulated within the narrow bounds of their discipline. The “plunge into the unknown” here refers to unknown unknowns, messier situations where not only are the outcomes unknown, even the risks themselves are unknown.

Doubly and triply periodic functions

A function f is periodic if there exists a constant period ω such that f(x) = f(x + ω) for all x. For example, sine and cosine are periodic with period 2π.

There’s only one way a function on the real line can be periodic. But if you think of functions of a complex variable, it makes sense to look at functions that are periodic in two different directions. Sine and cosine are periodic as you move horizontally across the complex plane, but not if you move in any other direction. But you could imagine a function that’s periodic vertically as well as horizontally.

A doubly periodic function satisfies f(x) = f(x + ω1) and f(x) = f(x + ω2) for all x and for two different fixed complex periods, ω1 and ω2, with different angular components, i.e. the two periods are not real multiples of each other. For example, the two periods could be 1 and i.

How many doubly periodic functions are there? The answer depends on how much regularity you require. If you ask that the functions be differentiable everywhere as functions of a complex variable (i.e. entire), the only doubly periodic functions are constant functions [1]. But if you relax your requirements to allow functions to have singularities, there’s a wide variety of functions that are doubly periodic. These are the elliptic functions. They’re periodic in two independent directions, and meromorphic (i.e. analytic except at isolated poles). [2]

What about triply periodic functions? If you require them to be meromorphic, then the only triply periodic functions are constant functions. To put it another way, if a meromorphic function is periodic in three directions, it’s periodic in every direction for every period, i.e. constant. If a function has three independent periods, you can construct a sequence with a limit point where the function is constant, and so it’s constant everywhere.

Read more: Applied complex analysis

* * *

[1] Another way to put this is to say that elliptic functions must have at least one pole inside the parallelogram determined by the lines from the origin to ω1 and ω2. A doubly periodic function’s values everywhere are repeats of its values on this parallelogram. If the function were continuous over this parallelogram (i.e. with no poles) then it would be bounded over the parallelogram and hence bounded everywhere. But Liovuille’s theorem says a bounded entire function must be constant.

[2] We don’t consider arbitrary singularities, only isolated poles. There are doubly periodic functions with essential singularities, but these are outside the definition of elliptic functions.

Taking away a damaging tool

This is a post about letting go of something you think you need. It starts with an illustration from programming, but it’s not about programming.

Bob Martin published a dialog yesterday about the origin of structured programming, the idea that programs should not be written with goto statements but should use less powerful, more specialized ways to transfer control. Edsgar Dijkstra championed this idea, most famously in his letter Go-to statement considered harmful. Since then there have been countless “considered harmful” articles that humorously allude to Dijkstra’s letter.

Toward the end of the dialog, Uncle Bob’s interlocutor says “Hurray for Dijkstra” for inventing the new technology of structured programming. Uncle Bob corrects him

New Technology? No, no, you misunderstand. … He didn’t invent anything. What he did was to identify something we shouldn’t do. That’s not a technology. That’s a discipline.

        Huh? I thought Structured Programming made things better.

Oh, it did. But not by giving us some new tools or technologies. It made things better by taking away a damaging tool.

The money quote is the last line above: It made things better by taking away a damaging tool.

Creating new tools gets far more attention than removing old tools. How might we be better off by letting go of a tool? When our first impulse is that we need a new technology, might we need a new discipline instead?

Few people have ever been able to convince an entire profession to let go of a tool they assumed was essential. If we’re to have any impact, most of us will need to aim much, much lower. It’s enough to improve our personal productivity and possibly that of a few peers. Maybe you personally would be better off without something that is beneficial to most people.

What are some technologies you’ve found that you’re better off not using?

Negative space blog posts

Julia for Python programmers

One of my clients is writing software in Julia so I’m picking up the language. I looked at Julia briefly when it first came out but haven’t used it for work. My memory of the language was that it was almost a dialect of Python. Now that I’m looking at it a little closer, I can see more differences, though the most basic language syntax is more like Python than any other language I’m familiar with.

Here are a few scattered notes on Julia, especially on how it differs from Python.

  • Array indices in Julia start from 1, like Fortran and R, and unlike any recent language that I know of.
  • Like Python and many other scripting languages, Julia uses # for one-line comments. It also adds #= and =# for multi-line comments, like /* and */ in C.
  • By convention, names of functions that modify their first argument end in !. This is not enforced.
  • Blocks are indented as in Python, but there is no colon at the end of the first line, and there must be an end statement to close the block.
  • Julia uses elseif as in Perl, not elif as in Python [1].
  • Julia uses square brackets to declare a dictionary. Keys and values are separated with =>, as in Perl, rather than with colons, as in Python.
  • Julia, like Python 3, returns 2.5 when given 5/2. Julia has a // division operator, but it returns a rational number rather than an integer.
  • The number 3 + 4i would be written 3 + 4im in Julia and 3 + 4j in Python.
  • Strings are contained in double quotes and characters in single quotes, as in C. Python does not distinguish between characters and strings, and uses single and double quotes interchangeably.
  • Julia uses function to define a function, similar to JavaScript and R, where Python uses def.
  • You can access the last element of an array with end, not with -1 as in Perl and Python.

* * *

[1] Actually, Perl uses elsif, as pointed out in the comments below. I can’t remember when to use else if, elseif, elsif, and elif.

Nicholas Higham on Mathematics in Color

This is reprint of Nick Higham’s post of the same title from the Princeton University Press blog, used with permission.
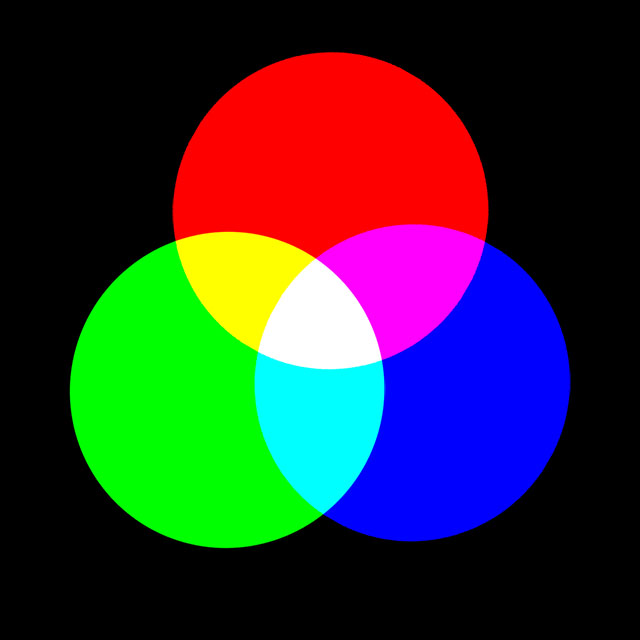
circle-rgb.jpg

Color is a fascinating subject. Important early contributions to our understanding of it came from physicists and mathematicians such as Newton, Young, Grassmann, Maxwell, and Helmholtz. Today, the science of color measurement and description is well established and we rely on it in our daily lives, from when we view images on a computer screen to when we order paint, wallpaper, or a car, of a specified color.

For practical purposes color space, as perceived by humans, is three-dimensional, because our retinas have three different types of cones, which have peak sensitivities at wavelengths corresponding roughly to red, green, and blue. It’s therefore possible to use linear algebra in three dimensions to analyze various aspects of color.

Metamerism

A good example of the use of linear algebra is to understand metamerism, which is the phenomenon whereby two objects can appear to have the same color but are actually giving off light having different spectral decompositions. This is something we are usually unaware of, but it is welcome in that color output systems (such as televisions and computer monitors) rely on it.

Mathematically, the response of the cones on the retina to light can be modeled as a matrix-vector product Af, where A is a 3-by-n matrix and f is an n-vector that contains samples of the spectral distribution of the light hitting the retina. The parameter n is a discretization parameter that is typically about 80 in practice. Metamerism corresponds to the fact that Af1 = Af2  is possible for different vectors f1 and f2. This equation is equivalent to saying that Ag = 0 for a nonzero vector gf1 – f2, or, in other words, that a matrix with fewer rows than columns has a nontrivial null space.

Metamerism is not always welcome. If you have ever printed your photographs on an inkjet printer you may have observed that a print that looked fine when viewed indoors under tungsten lighting can have a color cast when viewed in daylight.

LAB Space: Separating Color from Luminosity

In digital imaging the term channel refers to the grayscale image representing the values of the pixels in one of the coordinates, most often R, G, or B (for red, green, and blue) in an RGB image. It is sometimes said that an image has ten channels. The number ten is arrived at by combining coordinates from the representation of an image in three different color spaces. RGB supplies three channels, a space called LAB (pronounced “ell-A-B”) provides another three channels, and the last four channels are from CMYK (cyan, magenta, yellow, black), the color space in which all printing is done.

LAB is a rather esoteric color space that separates luminosity (or lightness, the L coordinate) from color (the A and B coordinates). In recent years photographers have realized that LAB can be very useful for image manipulations, allowing certain things to be done much more easily than in RGB. This usage is an example of a technique used all the time by mathematicians: if we can’t solve a problem in a given form then we transform it into another representation of the problem that we can solve.

As an example of the power of LAB space, consider this image of aeroplanes at Schiphol airport.

060721-1320-30-8896-org.jpg

Original image.

Suppose that KLM are considering changing their livery from blue to pink. How can the image be edited to illustrate how the new livery would look? “Painting in” the new color over the old using the brush tool in image editing software would be a painstaking task (note the many windows to paint around and the darker blue in the shadow area under the tail). The next image was produced in
just a few seconds.

060721-1320-30-8896-lab.jpg

Image converted to LAB space and A channel flipped.

How was it done? The image was converted from RGB to LAB space (which is a nonlinear transformation) and then the coordinates of the A channel were replaced by their negatives. Why did this work? The A channel represents color on a green–magenta axis (and the B channel on a blue–yellow axis). Apart from the blue fuselage, most pixels have a small A component, so reversing the sign of this component doesn’t make much difference to them. But for the blue, which has a negative A component, this flipping of the A channel adds just enough magenta to make the planes pink.

You may recall from earlier this year the infamous photo of a dress that generated a huge amount of interest on the web because some viewers perceived the dress as being blue and black while others saw it as white and gold. A recent paper What Can We Learn from a Dress with Ambiguous Colors? analyzes both the photo and the original dress using LAB coordinates. One reason for using LAB in this context is its device independence, which contrasts with RGB, for which the coordinates have no universally agreed meaning.

Nicholas J. Higham is the Richardson Professor of Applied Mathematics at The University of Manchester, and editor of The Princeton Companion to Applied Mathematics. His article Color Spaces and Digital Imaging in The Princeton Companion to Applied Mathematics gives an introduction to the mathematics of color and the representation and manipulation of digital images. In particular, it emphasizes the role of linear algebra in modeling color and gives more detail on LAB space.

Related posts

Mixing Haskell and R

It would be hard to think of two programming languages more dissimilar than Haskell and R.

Haskell was designed to enforce programming discipline; R was designed for interactive use. Haskell emphasizes correctness; R emphasizes convenience.  Haskell emphasizes computer efficiency; R emphasizes interactive user efficiency. Haskell was written to be a proving ground for programming language theorists. R was written to be a workbench for statisticians. Very different goals lead to very different languages.

When I first heard of a project to mix Haskell and R, I was a little shocked. Could it even be done? Aside from the external differences listed above, the differences in language internals are vast. I’m very impressed that the folks at Tweag I/O were able to pull this off. Their HaskellR project lets you call R from Haskell and vice versa. (It’s primarily for Haskell calling R, though you can call Haskell functions from your R code: Haskell calling R calling Haskell. It kinda hurts your brain at first.) Because the languages are so different, some things that are hard in one are easy in the other.

I used HaskellR while it was under initial development. Our project was written in Haskell, but we wanted to access R libraries. There were a few difficulties along the way, as with any project, but these were resolved and eventually it just worked.

* * *

Related: Help integrating R into your environment

The Fast Fourier Transform (FFT) and big data

The most direct way to compute a Fourier transform numerically takes O(n2) operations. The Fast Fourier Transform (FFT) can compute the same result in O(n log n) operations. If n is large, this can be a huge improvement.

James Cooley and John Tukey (re)discovered the FFT in 1965. It was thought to be an original discovery at the time. Only later did someone find a sketch of the algorithm in the papers of Gauss.

Daniel Rockmore wrote the article on the Fast Fourier Transform in The Princeton Companion to Applied Mathematics. He says

In this new world of 1960s “big data,” a clever reduction in computational complexity (a term not yet widely in use) could make a tremendous difference.

Rockmore adds a very interesting footnote to the sentence above:

Many years later Cooley told me that he believed that the Fast Fourier transform could be thought of as one of the inspirations for asymptotic algorithmic analysis and the study of computational complexity, as previous to the publication of his paper with Tukey very few people had considered data sets large enough to suggest the utility of an asymptotic analysis.

Related posts

Generalization of Fibonacci ratios

Each Fibonacci number is the sum of its two predecessors. My previous post looked at generalizing this to the so-called Tribonacci numbers, each being the sum of its three predecessors. One could keep going, defining the Tetrabonacci numbers and in general the n-Fibonacci numbers for any n at least 2.

For the definition to be complete, you have to specify the first n of the n-Fibonacci numbers. However, these starting values hardly matter for our purposes. We want to look at the limiting ratio of consecutive n-Fibonacci numbers, and this doesn’t depend on the initial conditions. (If you were determined, you could find starting values where this isn’t true. It’s enough to pick integer initial values, at least one of which is not zero.)

As shown in the previous post, the ratio is the largest eigenvalue of an n by n matrix with 1’s on the first row and 1’s immediately below the main diagonal. The characteristic polynomial of such a matrix is

λn − λn−1 − λn−2 − … −1

and so we look for the largest zero of this polynomial. We can sum the terms with negative coefficients as a geometric series and show that the eigenvalues satisfy

λn − 1/(2 − λ) = 0.

So the limiting ratio of consecutive n-Fibonacci numbers is the largest root of the above equation. You could verify that when n = 2, we get the golden ratio φ as we should, and when n = 3 we get around 1.8393 as in the previous post.

As n gets large, the limiting ratio approaches 2. You can see this by taking the log of the previous equation.

n = −log(2 − λ)/log(λ).

As n goes to infinity, λ must approach 2 so that the right side of the equation also goes to infinity.

Power method and Fibonacci numbers

Take an n × n matrix A and a vector x of length n. Now multiply x by A, then multiply the result by A, over and over again. The sequence of vectors generated by this process will converge to an eigenvector of A. (An eigenvector is a vector whose direction is unchanged when multiplied by A. Multiplying by A may stretch or shrink the vector, but it doesn’t rotate it at all. The amount of stretching is call the corresponding eigenvalue.)

The eigenvector produced by this process is the eigenvector corresponding to the largest eigenvalue of A, largest in absolute value. This assumes A has a unique eigenvector associated with its largest eigenvalue. It also assumes you’re not spectacularly unlucky in your choice of vector to start with.

Assume your starting vector x has some component in the direction of the v, the eigenvector corresponding to the largest eigenvalue. (The vectors that don’t have such a component lie in an n − 1 dimensional subspace, which would has measure zero. So if you pick a starting vector at random, with probability 1 it will have some component in the direction we’re after. That’s what I meant when I said you can’t start with a spectacularly unlucky initial choice.) Each time you multiply by A, the component in the direction of v gets stretched more than the components orthogonal to v. After enough iterations, the component in the direction of v dominates the other components.

What does this have to do with Fibonacci numbers? The next number in the Fibonacci sequence is the sum of the previous two. In matrix form this says

\left[\begin{array}{c} x_{n+1} \\\ x_{n} \end{array}\right] = \left[\begin{array}{cc} 1 & 1 \\\ 1 & 0 \end{array}\right] \left[\begin{array}{c} x_{n} \\\ x_{n-1} \end{array}\right]

The ratio of consecutive Fibonacci numbers converges to the golden ratio φ because φ is the largest eigenvalue of the matrix above.

The first two Fibonacci numbers are 1 and 1, so the Fibonacci sequence corresponds to repeatedly multiplying by the matrix above, starting with the initial vector x = [1 1]T. But you could start with any other vector and the ratio of consecutive terms would converge to the golden ratio, provided you don’t start with a vector orthogonal to [1 φ]T. Starting with any pair of integers, unless both are zero, is enough to avoid this condition, since φ is irrational.

We could generalize this approach to look at other sequences defined by a recurrence relation. For example, we could look at the “Tribonacci” numbers. The Tribonacci sequence starts out 1, 1, 2, and then each successive term is the sum of the three previous terms. We can find the limiting ratio of Tribonacci numbers by finding the largest eigenvalue of the matrix below.

\left[\begin{array}{ccc} 1 & 1 & 1 \\\ 1 & 0 & 0 \\\ 0 & 1 & 0 \end{array}\right]

This eigenvalue is the largest root of

x3x2x − 1 = 0,

which is about 1.8393. As before, the starting values hardly matter. Start with any three integers, at least one of them non-zero, and define each successive term to be the sum of the previous three terms. The ratio of consecutive terms in this series will converge to 1.8393.

By the way, you could compute the limiting ratio of Tribonacci numbers with the following bit of Python code:

      from scipy import matrix, linalg
      M = matrix([[1, 1, 1], [1, 0, 0], [0, 1, 0]])
      print( linalg.eig(M) )

Update: The next post generalizes this one to n-Fibonacci numbers.