Contraharmonic mean

I’ve mentioned the harmonic mean multiple times here, most recently last week. The harmonic mean pops up in many contexts.

The contraharmonic mean is a variation on the harmonic mean that comes up occasionally, though not as often as its better known sibling.

Definition

The contraharmonic mean of two positive numbers a and b is

C = \frac{a^2 + b^2}{a + b}

and more generally, the contraharmonic mean of a sequence of positive numbers is the sum of their squares over their sum.

Why the name?

What is “contra” about the contraharmonic mean? The harmonic mean and contraharmonic mean have a sort of reciprocal relationship. The ratio

\frac{a - m}{m - b}

equals a/b when m is the harmonic mean and it equals b/a when m is the contraharmonic mean.

Geometric visualization

Construct a trapezoid with two vertical sides, one of length a and another of length b. The vertical slice through the intersection of the diagonals, the dashed blue line in the diagram below, has length equal to the harmonic mean of a and b.
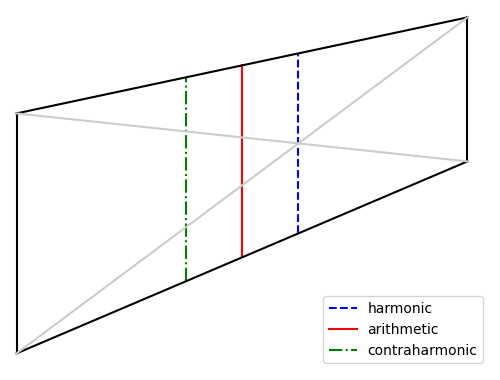
The vertical slice midway between the two vertical sides, the solid red line in the diagram, has length equal to the arithmetic mean of a and b.

The vertical slice on the opposite side of the red line, as from the red line on one side as the blue line is on the other, the dash-dot green line above, has length equal to the contraharmonic mean of a and b.

Connection to statistics

The contraharmonic mean of a list of numbers is the ratio of the sum of the squares to the sum. If we divide the numerator and denominator by the number of terms n we see this is the ratio of the second moment to the first moment, i.e. the mean of the squared values divided the mean of the values.

This smells like the ratio of variance to mean, known as the index of dispersion D, except variance is the second central moment rather than the second moment. The second moment equals variance plus the square of the mean, and so

D = \frac{\sigma^2}{\mu}

and

C = \frac{\text{E}(X^2)}{\text{E}(X)} = \frac{\sigma^2 + \mu^2}{\mu} = D + \mu.

How Albrecht Dürer drew an 11-sided figure

You cannot exactly construct an 11-sided regular polygon (called a hendecagon or an undecagon) using only a straight edge and compass. Gauss fully classified which regular n-gons can be constructed, and this isn’t one of them [1].

However, Albrecht Dürer [2] came up with a good approximate construction for a hendecagon.

To construct an eleven-sided figure by means of a compass, I take a quarter of a circle’s diameter, extend it by one eighth of its length, and use this for the construction of of the eleven-sided figure.

It took some trial and error for me to understand what Dürer meant.

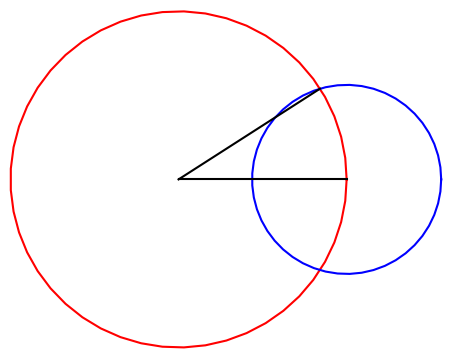
In more explicit terms, draw a circle of radius R centered at the origin. Then draw a circle of radius 9R/16 centered at (R, 0). Then draw a line from the origin to the intersection of the two circles. (There are two intersections, and it doesn’t matter which one you pick.) Then this line makes an angle of approximately (360/11) degrees with the x-axis.

Without loss of generality we can assume R = 1. A point at the intersection of both circles satisfies the equation of each circle, and from these two equations in two unknowns we can determine that the x coordinate of the two intersection points is 431/512. We can then use the Pythagorean theorem to solve for y and find the inverse tangent of y/x. This shows that we’ve constructed an angle of 32.6696°. We were after an angle of 32.7272°, and so the relative error in Dürer’s approximation is less than 0.2%.

Diagram of Durer's construction

To be even more explicit, here is the Python code that created the image above.

    import matplotlib.pyplot as plt
    from numpy import linspace, sin, cos, pi

    r = 9/16
    t = linspace(0, 2*pi)
    plt.plot(cos(t), sin(t), 'r-')
    plt.plot(r*cos(t) + 1, r*sin(t), 'b-')

    x = 431/512
    y = (1 - x*x)**0.5
    plt.plot([0, 1], [0, 0], 'k')
    plt.plot([0, x], [0, y], 'k')

    plt.gca().set_aspect("equal")
    plt.axis("off")
    plt.savefig("durer11.png")

More Dürer posts

[1] The Guass-Wantzel theorem says a regular n-gon can be constructed with straight edge and compass if n factors into a power of 2 and distinct Fermat primes.

[2] I found this in A Panoply of Polygons which in turn cites “The Polygons of Albrecht Durer -1525” By Gordon Hughes, available on arXiv.

A pentagon, hexagon, and decagon walk into a bar …

The new book A Panoply of Polygons cites a theorem Euclid (Proposition XIII.10) saying

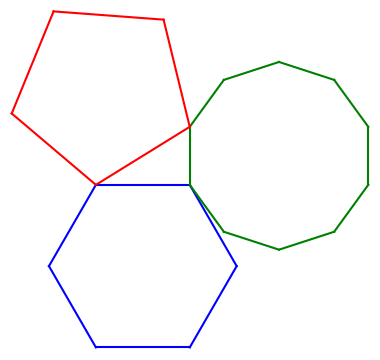
If a regular pentagon, a regular hexagon, and a regular decagon are inscribed in congruent circles, then their side lengths form a right triangle.

This isn’t exactly what Euclid said, but it’s an easy deduction from what he did say.

Here’s an illustration.

Illustrating Euclid Proposition XIII.10

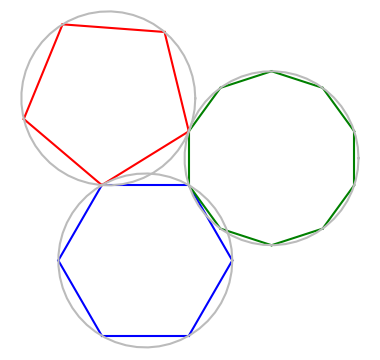
Update: Ralph Corderoy suggested in the comments that it would be good to add the congruent circles through the polygon vertices. Here is a graphic with the circles added.

Illustrating Euclid Proposition XIII.10

Connection with golden ratio

I learned about this theorem from the book cited above, which arrived in the mail yesterday. The figure looked familiar because Cliff Pickover had posted essentially the same illustration on Twitter recently, saying that not only is there a right triangle in the middle of the diagram, this triangle is half of a golden rectangle.

The length of the side of a regular polygon with n sides is 2R sin(π/n) where R is the radius of the circle through the vertices. So to prove that the ratio between the side of the hexagon and the side of the decagon is the golden ratio φ, it suffices to prove

sin(π/6) / sin(π/10) = φ

You could verify this in Mathematica by seeing that the following returns True.

    Sin[Pi/6]/ Sin[Pi/10] == GoldenRatio

Python code

Here’s the code I used to create the image above.

    from numpy import exp, pi, arange
    import matplotlib.pyplot as plt
    
    # Vertices of a hexagon
    hexa = exp(2j*pi*arange(6)/6)
    
    # Vertices of a decagon, shifted and rotated
    # to have a side perpendicular to the hexagon
    deca = exp(2j*pi*(0.5+arange(10))/10)
    deca += hexa[1] - deca[5]
    
    # Shift and rotate a pentagon to share one vertex 
    # with the hexagon and one vertex with the decagon
    omega = exp(2j*pi/5)
    c = (hexa[2]*omega - deca[4])/(omega - 1)
    penta = c + (hexa[2] - c)*exp(2j*pi*arange(5)/5) 
    
    def connect(p, q, c):
        plt.plot([p.real, q.real], [p.imag, q.imag], '-', color=c)
    
    plt.gca().set_aspect("equal")
    
    for n in range(-1, 5):
        connect(hexa[n], hexa[n+1], 'blue')
    for n in range(-1, 9):
        connect(deca[n], deca[n+1], 'green')
    for n in range(-1, 4):
        connect(penta[n], penta[n+1], 'red')
    
    plt.show()

The ability to use −1 to as the index to the last element of an array simplifies the code that connects the vertices. In a language like C you’d have to write an extra statement after your loop to join the last vertex to the first.

When I first saw the illustration in Panoply of Pentagons I though that the top of the pentagon was parallel to the top of the hexagon. When I wrote the Python code first assuming this orientation of the pentagon, things didn’t line up. Writing the code made me pay closer attention, as is often the case.

Related posts

A new trig identity

This evening I ran across a trig identity I hadn’t seen before. I doubt it’s new to the world, but it’s new to me.

Let A, B, and C be the angles of an arbitrary triangle. Then

sin² A + sin² B + sin² C = 2 + 2 cos A cos B cos C.

This looks a little like the Pythagorean theorem, but the Pythagorean theorem involves the sides of a triangle, not the angles. (I expect there’s an interesting generalization of the identity above to spherical geometry where sides are angles.)

This identity also looks a little like the law of cosines, but the law of cosines mixes sides and angles, and this identity only involves angles.

Source: Lemma 4.4.3 in A Panoply of Polygons by Claudi Alsina and Roger B. Nelsen.

Double duals of polyhedra

The previous post mentioned the dual of a tetrahedron is another tetrahedron. The dual of a cube is an octahedron and the dual of an octahedron is a cube. And the dual of a dodecahedron is an icosahedron, and the dual of an icosahedron is a dodecahedron.

So if you take the dual of a regular solid twice, you get back another regular solid of the same type. But you do not get the same regular solid back. To see this, let’s look at how you form the dual of a polyhedron.

To find the dual of a polyhedron, you make a new polyhedron whose vertices are the centroids of the faces of the original polyhedron. The vertices of a regular polyhedron all lie on the surface of a sphere. A face of the polygon lies inside the sphere, so the centroids of the solid are all inside the sphere. Since the centroids form the vertices of a regular solid, they also all lie on a sphere, but a smaller sphere inside the first sphere.

Size of duals

If you take the double dual of a regular solid, the dual of the dual, then you get a smaller solid of the same type. How much smaller? We can get Mathematica to calculate this for us.

The function DualPolyhedron does what the name implies. Let’s apply this to the default tetrahedron. When we enter

    DualPolyhedron[ Tetrahedron[] ]

we get back

    Tetrahedron[{2 Pi/3}, Pi}, 1/3]

The default tetrahedron, returned by calling Tetrahedron[], has vertices

  • (1, 0, 0)
  • (0, 0, 1)
  • (1, 0, 1)
  • (1, 1, 1)

Each edge has length 1. Its dual has been rotated by 2π/3 about the z axis and by π about the y axis, and has edges of length 1/3. Taking the dual of a tetrahedron rotates the tetrahedron and shrinks it by a factor of 3 (in each dimension).

Size of double duals

If we take the double dual of a tetrahedron, we get a tetrahedron nine times smaller. Let’s see what happens to the rest of the regular solids.

    DualPolyhedron[DualPolyhedron[#]] & /@ 
        {Tetrahedron[], Octahedron[], Cube[],
         Dodecahedron[], Icosahedron[]}

This tells us again what we found above for the double dual of a tetrahedron. It also tells us that taking the double dual of an octahedron or cube results in an octahedron or cube 3 times smaller. And it tells us that taking the double dual of a dodecahedron or icosahedron reduces its size by a factor of

(5 + 2√ 5)/15 = 0.6314…

Taking the double dual shrinks a regular solid, and the amount of shrinkage goes down as the number of faces goes up.

Orientation of double duals

The process of taking the double dual may also rotate the solid. The second dual of the standard tetrahedron, for example, is not just 9 times smaller. It’s also been rotated. We can see this by calling PolyhedronCoordinates. The code

    PolyhedronCoordinates[ 
        DualPolyhedron[ DualPolyhedron[ Tetrahedron[] ] ] ]

shows that the new vertices are

  • (7/9, 2/9, 6/9)
  • (7/9, 2/9, 7/9)
  • (7/9, 3/9, 7/9)
  • (6/9, 2/9, 7/9)

So the second dual of the tetrahedron is not just 9 times smaller.

However, taking the double dual of the rest of the regular solids does not change the orientation. You could verify this for the cube and dodecahedron using Mathematica. It then follows that taking the double dual of octahedra and icosahedra does not change the orientation.

Sixth dual

If you take the dual of a tetrahedron 6 times you do return to the original orientation, but not if you take the dual fewer times. You can verify this by running the following:

    NestList[DualPolyhedron, Tetrahedron[], 6]

Related posts

Solid angle of a star

The apparent size of a distant object can be measured by projecting the object onto a unit sphere around the observer and calculating the area of the projected image.

A unit sphere has area 4π. If you’re in a ship far from land, the solid angle of the sky is 2π steradians because it takes up half a sphere.

If the object you’re looking at is a sphere of radius r whose center is a distance d away, then its apparent size is

\Omega = 2\pi\left(1 - \frac{\sqrt{d^2 - r^2}}{d}\right)

steradians. This formula assumes d > r. Otherwise you’re not looking out at the sphere; you’re inside the sphere.

If you’re looking at a star, then d is much larger than r, and we can simplify the equation above. The math is very similar to the math in an earlier post on measuring tapes. If you want to measure the size of a room, and something is blocking you from measuring straight from wall to wall, it doesn’t make much difference if the object is small relative to the room. It all has to do with Taylor series and the Pythagorean theorem.

Think of the expression above as a function of r and expand it in a Taylor series around r = 0.

\Omega = 2\pi\left(1 - \frac{\sqrt{d^2 - r^2}}{d}\right) = 2\pi\left(\frac{\sqrt{r^2}}{2d^2} + \frac{r^4}{8d^4} + \cdots \right)

and so

\Omega \approx \frac{\pi r^2}{d^2}

with an error on the order of (r/d)4. To put it another way, the error in our approximation for Ω is on the order of Ω². The largest object in the sky is the sun, and it has apparent size less than 10-4, so Ω is always small when looking at astronomical objects, and Ω² is negligible.

So for practical purposes, the apparent size of a celestial object is π times the square of the ratio of its radius to its distance. This works fine for star gazing. The approximation wouldn’t be as accurate for watching a hot air balloon launch up close.

Square degrees

Sometimes solid angles are measured in square degrees, given by π/4 times the square of the apparent diameter in degrees. This implicitly uses the approximation above since the apparent radius is r/d.

(The area of a square is diameter squared, and a circle takes up π/4 of a square.)

Examples

When I typed

    3.1416 (radius of sun / distance to sun)^2

into Wolfram Alpha I got 6.85 × 10⁻⁵. (When I used “pi” rather than 3.1416 it interpreted this as the radius of a pion particle.)

When I typed

    3.1416 (radius of moon / distance to moon)^2

I got 7.184 × 10⁻⁵, confirming that the sun and moon are approximately the same apparent size, which makes a solar eclipse possible.

The brightest star in the night sky is Sirius. Asking Wolfram Alpha

    3.1416 (radius of Sirius / distance to Sirius)^2

we get 6.73 × 10⁻¹⁶.

Related posts

Interpolating rotations with SLERP

Naive interpolation of rotation matrices does not produce a rotation matrix. That is, if R1 and R2 are rotation (orthogonal) matrices and 0 < t < 1, then

R(t) = (1-t)R_1 + tR_2

is not in general a rotation matrix.

You can represent rotations with unit quaternions rather than orthogonal matrices (see details here), so a reasonable approach might be to interpolate between the rotations represented by unit quaternions q1 and q2 using

q(t) = (1-t)q_1 + tq_2

but this has a similar problem: the quaternion above is not a unit quaternion.

One way to patch this up would be to normalize the expression above, dividing by its norm. That would indeed produce unit quaternions, and hence correspond to rotations. However, uniformly varying t from 0 to 1 does not produce a uniform rotation.

The solution, first developed by Ken Shoemake [1], is to use spherical linear interpolation or SLERP.

Let θ be the angle between q1 and q2. Then the spherical linear interpolation between q1 and q2 is given by

q(t) = \frac{\sin((1-t)\theta)}{\sin\theta}q_1 + \frac{\sin(t\theta)}{\sin\theta}q_2

Now q(t) is a unit quaternion, and uniformly increasing t from 0 to 1 creates a uniform rotation.

[1] Ken Shoemake. “Animating Rotation with Quaternion Curves.” SIGGRAPH 1985.

Another Napoleon-like theorem

A little while back I wrote about Napoleon’s theorem for triangles. A little later I wrote about Van Aubel’s theorem, a sort of analogous theorem quadrilaterals. This post presents another analog of Napoleon’s theorem for quadrilaterals.

Napoleaon’s theorem says that if you start with any triangle, and attach equilateral triangles to each side, the centroids of these new triangles are the vertices of an equilateral triangle.

So if you attach squares to the sides of a quadrilateral, are their centroids the vertices of a square? In general no.

But you can attach squares to two sides, and special rectangles to the other two sides, and the centroids will form the corners of a square. Specifically, we have the following theorem by Stephan Berendonk [1].

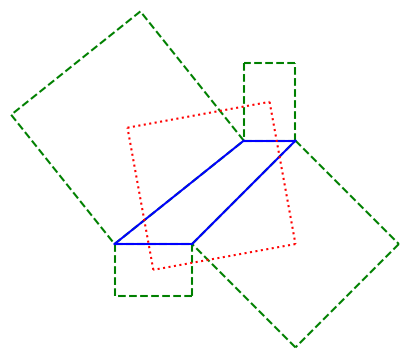
If you erect squares on the two “nonparallel” sides of a trapezoid and a rectangle on each of the two parallel sides, such that its “height” is equal to the length of the opposite side of the trapezoid, then the centers of the four erected quadrangles will form the vertices of a square.

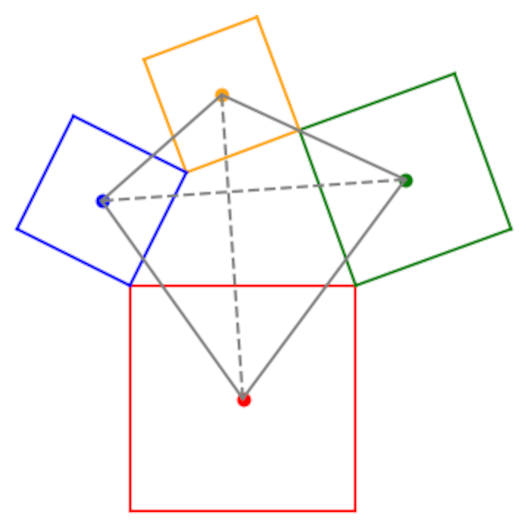
Here’s an illustration. Berendonk’s theorem asserts that the red quadrilateral is a square.

[1] Stephan Berendonk. A Napoleonic Theorem for Trapezoids. The American Mathematical Monthly, April 2019, Vol. 126, No. 4, pp. 367–369

Van Aubel’s theorem

Van Aubel’s theorem is analogous to Napoleon’s theorem, though not a direct generalization of it.

Napoleon’s theorem says to start with any triangle and draw equilateral triangles on each side. Connect the centers of the three new triangles, and you get an equilateral triangle.

Illustration of Napoleon's theorem

Now suppose you start with a quadrilateral and draw squares on each side. Connect the centers of the squares. Do you get a square? No, but you do get something interesting.

Van Aubel’s theorem says that if you connect the centers of squares on opposite faces of the quadrilateral (dashed lines below), the two line segments are the same length and perpendicular to each other.

The solid gray lines show that if you connect the centers of the square you do not get a square.

Further development

Van Aubel’s theorem dates to 1878 [1], and there have been numerous extensions ever since. Recently [2] Pellegrinetti found that six points related to Van Aubel’s theorem all lie on a circle. The six points are the midpoints of the two Van Aubel line segments (the dashed line segments above), the intersection of these two line segments, the midpoints of the two diagonals of the quadrilateral, and one more point.

The final point in Pellegrinetti’s theorem comes from flipping each of the squares over, connecting the centers, and noting where the connecting lines intersect. This is analogous to the messy case of Napoleon’s theorem: When you draw the squares on the inside of the quadrilateral rather than on the outside, the picture is hard to take in.

There are variations on Van Aubel’s theorem that generalize squares to rectangles, rhombi, and parallelograms. [3]

[1] Van Aubel, H., Note concernant les centres des carrés construits sur les cotés dun polygon quelconque, Nouv. Corresp. Math., 4 (1878), pp. 40–44.

[2] Dario Pellegrinetti. The Six-Point Circle for the Quadrangle. International Journal of Geometry. 4 (2019) No 2, pp. 5–13.

[3] Michael de Villiers. Generalizing Van Aubel Using Duality. Mathematics Magazine. Vol. 73, No. 4, October 2000. pp. 303–307

Converting between barycentric and trilinear coordinates

Barycentric coordinates describe the position of a point relative to the three vertices of a triangle. Trilinear coordinates describe the position of a point relative to the three sides of a triangle. It’s surprisingly simple to convert from one to the other.

Why should this be surprising? Because the distance from a point to a line is more complicated to compute than the distance between two points. Hiding this complication is one of the things that makes trilinear coordinates convenient for some tasks.

Both barycentric and trilinear coordinates are homogeneous. This means the coordinates are only unique up to a scaling factor. The proportions between the components are unique, not the components themselves. Barycentric and trilinear coordinates are written with colons separating the components as a reminder that they are proportions rather than absolute numbers.

If the vertices of our triangle are A, B, and C, the barycentric coordinates of a point P are proportional to the distances from P to A, B, and C. The trilinear coordinates of P are proportional to the distances from P to the sides opposite A, B, and C.

Let a be the length of the side opposite vertex A and similarly for b and c. Then a point with trilinear coordinates

x : y : z

has barycentric coordinates

ax : by : cz

Similarly, a point with barycentric coordinates

α : β : γ

has trilinear coordinates

α/a : β/b : γ/b.

If you have trilinear coordinates x : y : z you can find the actual distances to the sides of the triangle by scaling by a factor involving the area of the triangle. The distances to sides opposite A, B, and C are kx, ky, and kz respectively, where

k = area / (ax + by + cz).

Note that the denominator is the sum of the corresponding barycentric coordinates. This is because barycentric coordinates of P can be interpreted as the areas of the three triangles formed by drawing lines from P to each of the vertices.