The difference orbit inclination makes

Suppose you wanted to find the distance between Earth and Mars over time. To first approximation, both planets orbit the sun in elliptic orbits in the same plane.

If you wanted to be more accurate, you’d need to take into account the fact that the orbit of Mars is tilted about 1.85° relative to the Earth’s orbit. How much difference does that make?

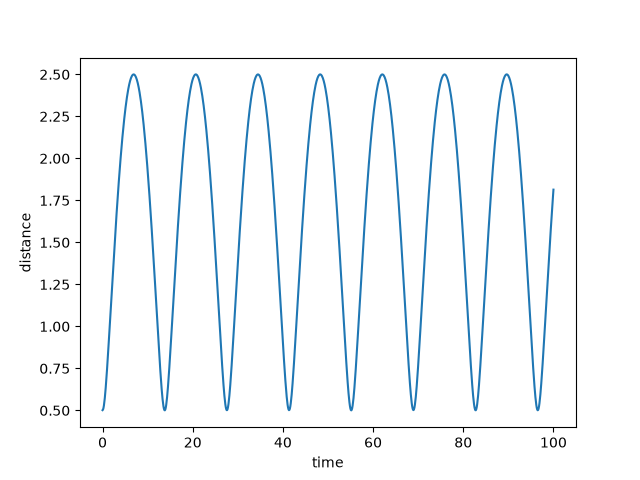
To simplify things, let’s assume the Earth orbits the sun in a circle of radius 1 and Mars orbits the sun in a circle of radius 1.5. The distance between Earth and Mars over time would be basically sinusoidal.

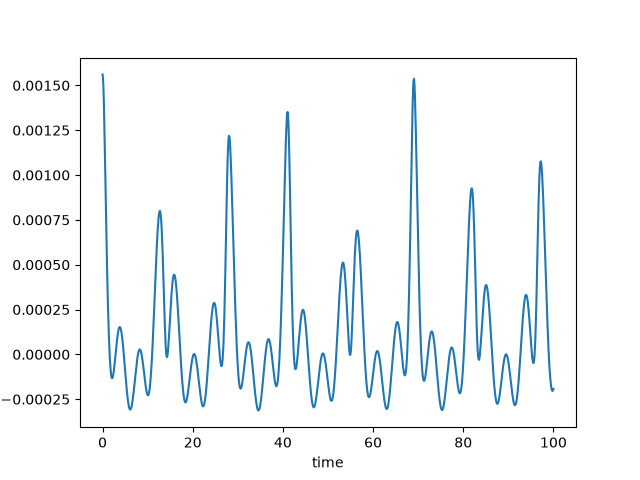
How much does inclination contribute to this distance? In other words, what is the difference between the distance accounting for the inclination of Mars’ orbit and the distance if we assume the two orbits are in the same plane?

This plot gives the answer.

The effect is not large, about three orders of magnitude smaller than the main effect, but it’s interesting how erratic it is.

The plots were made with the following code.

from numpy import *

R = 1.5
T = R**1.5 # Kepler's third law

def f(t, theta):
    return sqrt(
        (cos(t) - R*cos(t/T)*cos(theta))**2 +
        (sin(t) - R*sin(t/T))**2 +
        (R*sin(theta)*cos(t/T))**2
    )

The first plot graphs f(t, θ) and the second graphs f(t, θ) − f(t, 0).

Mean distance to the sun

Suppose you have a planet in an elliptical orbit around a star. The math is identical for any light object orbiting a heavy object, such as a moon or satellite orbiting a planet, but we’ll call the heavy object a star and the light object a planet.

The center of the star is not quite the center of the orbit. The planet moves along an ellipse with the star at one focus of that ellipse.

Let a be the semi-major axis of planet’s orbit, the maximum distance from the center of the ellipse to a point on the ellipse. Then the distance of a focus to the center of the ellipse is ae where e is the eccentricity of the ellipse. This defines eccentricity. The center of earth’s orbit is between three and four solar radii away from the center of the sun [1].

The planet is farthest from the star when it is along the major axis of the ellipse on the opposite side as the star. The distance is then a + ae, the distance to the center plus the distance from the center to the star. On the opposite side of its orbit, the planet is closest to the star. There the distance is aae. In summary the maximum distance to the star is

a(1 + e)

and the minimum distance is

a(1 − e).

If you had to guess the average distance between the planet and its star, a would be a good guess since it’s the average of the maximum and minimum distance. And that’s a good approximation, provided e is small. The mean distance over time is

a(1 + ½e²).

See derivation. The average distance is greater than a because the planet moves faster when nearest the star and slower when further from the star.

The relative error in approximating the mean distance by a is then ½e². When e is small, ½e² is very small. For the earth’s orbit, e = 0.01671, and so the approximation is off by around 0.014%.

The eccentricity of Pluto’s orbit is 0.2488, and so in that case the approximation is off by about 3.1%. The eccentricity of a Molniya orbit, used by some Russian satellites, is 0.74 [2]. For such satellites the error in approximating the mean distance to earth as the semimajor axis is around 27%.

Related posts

[1] For earth’s orbit, e = 0.01671, a = 1.496×10¹¹ m, and the sun’s radius is r = 6.957×10⁸ m. And so ear = 3.59.

[2] An object in such a highly elliptical orbit will spend a long time at the far side of its orbit, i.e. over Russia. Sort of a poor man’s geostationary orbit.

The Laplace limit

An earlier post discussed how to solve Kepler’s equation

ME − e sin(E)

using a sine series. You could also solve Kepler’s equation using a power series, which Lagrange did in 1771. Both approaches express E as a function of e and M, but from different perspectives. Bessel thought of his solution as a sum of sines in M, with coefficients that depend on e. Lagrange thought of his solution as a power series in e whose coefficients involve sines in M. You can rearrange the terms of either solution into the other.

The most interesting thing about the power series solution, in my opinion, is that it only converges for e less than roughly 2/3 while the sine series solution is valid for all e < 1. In astronomical terms, this means the power series solution works for the orbit of some planets but not others!

In our solar system, the planets all have eccentricity well below 2/3, but not all minor planets do. For example, the orbit of Eris has eccentricity 0.4407 but the orbit of Sedna has eccentricity 0.8549. And in other solar systems there are planets with eccentricity much greater than 2/3.

The Laplace limit

The radius of convergence for Lagrange’s power series solution is called the Laplace limit. Its value is eL = 0.6627…. There’s no obvious reason why there’s anything special about this value. There’s no astronomical reason for this value. It’s an artifact of the power series form of the solution.

If the series works for e = 0.66, you would reasonably think it works for e = 0.67, but that’s not the case. And if you’re observant, you might notice that although the series works for e = 0.66, it takes longer to converge than for smaller values of e; the rate of convergence is slowing down, warning you of danger ahead.

The exact value of eL is the unique real solution to the equation

x \exp\left(\sqrt{1 + x^2}\right) = 1 + \sqrt{1 + x^2}

There’s no obvious reason for this either. It has to do with finding the largest circle that can fit in a lens-shaped region of convergence. More on that here.

We can calculate eL with the following Python code.

from math import exp
from scipy.optimize import root_scalar

def f(x):
    t = (1 + x*x)**0.5
    return x*math.exp(t) - 1 - t

sol = root_scalar(f, bracket=[0, 1], method='brentq')
print(sol.root)

This prints 0.6627434193491817.

Series details

We can use the Lagrange inversion formula to find the series, just as Lagrange did two and a half centuries ago.

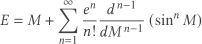
E = M+ \sum_{n=1}^{\infty} \frac{e^n}{n!} \frac{d^{\,n-1}}{dM^{\,n-1}} \left(\sin^n M\right)

The powers of sine can be expanded into the sum of sines of various frequencies and differentiated, leading to the equation

E = M+ \sum_{n=1}^{\infty} \frac{e^n}{2^{\,n-1}n!} \sum_{k=0}^{\lfloor n/2\rfloor} (-1)^k \binom{n}{k} (n-2k)^{n-1} \sin\!\big((n-2k)M\big)


From Kepler to Bessel

The previous post very briefly said that the integral representation for Bessel functions was motived by solving Kepler’s equation. This post will go into more detail.

Kepler’s equation

There are multiple ways to describe the position of a planet in an elliptical orbit around a star. For historical reasons, these descriptions have arcane names such as mean anomaly, true anomaly, and eccentric anomaly. This post explains how these three are related.

For this post, it is enough to say that often you know mean anomaly M and want to know eccentric anomaly E. These are related via Kepler’s equation

M = E - e \sin E
where e is the eccentricity of the orbit. You’d like to solve for E as a function of M and e, but there’s no elementary way to do that.

One way to solve Kepler’s equation is to take a guess at E and plug it into the right hand side of

E = M + e \sin E
to get a new E, and keep iterating until the two sides are closer together. I write more about this here.

Another approach to solving Kepler’s equation is to use Newton’s method. I write more about that here.

Still another approach is to expand E in a sine series and find the series coefficients. An advantage to this approach is that once you have the coefficients, you have an expression for E as a function of M, and you can plug in more values of M without having to solve Kepler’s equation for each value of M separately.

Sine series coefficients

Kepler’s equation is easy to solve at E = 0 and at E = π. In both cases, EM. So the function E − M is zero at both ends of [0, π], which suggests we try to expand E − M in a sine series

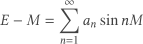
E - M = \sum_{n=1}^\infty a_n \sin nM

We then calculate the Fourier coefficients an as usual.

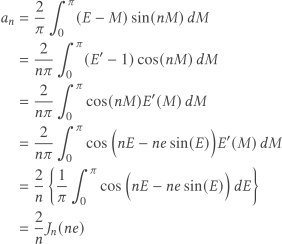
\begin{align*} a_n &= \frac{2}{\pi} \int_0^\pi (E-M) \sin(nM) \, dM \\ &= \frac{2}{n \pi} \int_0^\pi (E^\prime - 1) \cos(nM)\, dM \\ &= \frac{2}{n \pi} \int_0^\pi \cos(nM) E^\prime(M) \, dM \\ &= \frac{2}{n \pi} \int_0^\pi \cos\Big(nE - ne\sin(E)\Big) E^\prime(M) \, dM \\ &= \frac{2}{n} \left\{ \frac{1}{\pi} \int_0^\pi \cos\Big(nE - ne \sin(E)\Big)\, dE\right\} \\ &= \frac{2}{n} J_n(ne) \end{align*}

The second line uses integration by parts. The third line uses Kepler’s equation. The last line uses the definition of the Bessel functions Jn given in the previous post.

Roman moon, Greek moon

I used the term perilune in yesterday’s post about the flight path of Artemis II. When Artemis is closest to the moon it will be furthest from earth because its closest approach to the moon, its perilune, is on the side of the moon opposite earth.

Perilune is sometimes called periselene. The two terms come from two goddesses associated with the moon, the Roman Luna and the Greek Selene. Since the peri- prefix is Greek, perhaps periselene would be preferable. But we’re far more familiar with words associated with the moon being based on Luna than Selene.

The neutral terms for closest and furthest points in an orbit are periapsis and apoapsis. but there are more colorful terms that are specific to orbiting particular celestial objects. The terms perigee and apogee for orbiting earth (from the Greek Gaia) are most familiar, and the terms perihelion and aphelion (not apohelion) for orbiting the sun (from the Greek Helios) are the next most familiar.

The terms perijove and apojove are unfamiliar, but you can imagine what they mean. Others like periareion and apoareion, especially the latter, are truly arcane.

Artemis II, Apollo 8, and Apollo 13

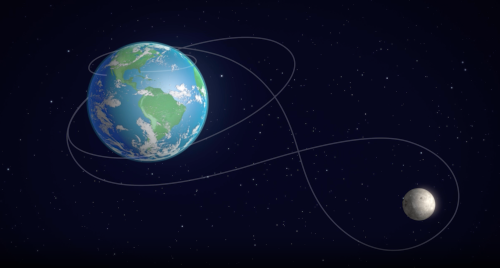
The Artemis II mission launched yesterday. Much like the Apollo 8 mission in 1968, the goal is to go around the moon in preparation for a future mission that will land on the moon. And like Apollo 13, the mission will swing around the moon rather than entering lunar orbit. Artemis II will deliberately follow the trajectory around the moon that Apollo 13 took as a fallback.

Apollo 8 spent 2 hours and 44 minutes in low earth orbit (LEO) before performing trans-lunar injection (TLI) and heading toward the moon. Artemis II made one low earth orbit before moving to high earth orbit (HEO) where it will stay for around 24 hours before TLI. The Apollo 8 LEO was essentially circular at an altitude of around 100 nautical miles. The Artemis II HEO is highly eccentric with an apogee of around 40,000 nautical miles.

Apollo 8 spent roughly three days traveling to the moon, measured as the time between TLI and lunar insertion orbit. Artemis II will not orbit the moon but instead swing past the moon on a “lunar free-return trajectory” like Apollo 13. The time between Artemis’ TLI and perilune (the closest approach to the moon, on the far side) is expected to be about four days. For Apollo 13, this period was three days.

The furthest any human has been from earth was the Apollo 13 perilune at about 60 nautical miles above the far side of the moon. Artemis is expected to break this record with a perilune of between 3,500 and 5,200 nautical miles.

Related posts

Visualizing orbital velocity

The shape of a planet’s orbit around a star is an ellipse. To put it another way, a plot of the position of a planet’s orbit over time forms an ellipse. What about the velocity? Is its plot also an ellipse? Surprisingly, a plot of the velocity forms a circle even if a plot of the position is an ellipse.

If an object is in a circular orbit, it’s velocity vector traces out a circle too, with the same center. If the object is in an elliptical orbit, it’s velocity vector still traces out a circle, but one with a different center. When the orbit is eccentric, the hodograph, the figure traced out by the velocity vector, is also eccentric, though the two uses of the word “eccentric” are slightly different.

The eccentricity e of an ellipse is the ratio c/a where c is the distance between the two foci and a is the semi-major axis. For a circle, c = 0 and so e = 0. The more elongated an ellipse is, the further apart the foci are relative to the axes and so the greater the eccentricity.

The plot of the orbit is eccentric in the sense that the two foci are distinct because the shape is an ellipse. The hodograph is eccentric in the sense that the circle is not centered at the origin.

The two kinds of eccentricity are related: the displacement of the center of the hodograph from the origin is proportional to the eccentricity of the ellipse.

Imagine the the orbit of a planet with its major axis along the x-axis and the coordinate of its star positive.  The hodograph is a circle shifted up by an amount proportional to the eccentricity of the orbit e. The top of the circle corresponds to perihelion, the point closest to the star, and the bottom corresponds to aphelion, the point furthest from the star. For more details, see the post Max and min orbital speed.

Satellites have a lot of room

I saw an animation this morning showing how the space above our planet is dangerously crowded with satellites. That motivated me to do a little back-of-the-envelope math.

The vast majority of satellites are in low earth orbit (LEO), which extends from 160 to 2000 km above the earth’s surface. The radius of the earth is about 6400 km, so the volume of the LEO region is

\frac{4\pi}{3} \left((6400 + 2000)^3 - (6400 + 160)^3\right) \text{km}^3 = 1.3 \times 10^{12} \,\text{km}^3

There are about 12,500 satellites in LEO, so the average volume of LEO per satellite is about 100,000,000 km³.

Now this isn’t the last word in collision avoidance—there are lots of complications we’re not going to get into here—but it is the first word: there’s a lot of space in space.

Bowie integrator and the nonlinear pendulum

I recently learned of Bowie’s numerical method for solving ordinary differential equations of the form

y″ = f(y)

via Alex Scarazzini’s masters thesis [1].

The only reference I’ve been able to find for the method, other than [1], is the NASA Orbital Flight Handbook from 1963. The handbook describes the method as “a method employed by C. Bowie and incorporated in many Martin programs” and says nothing more about its origin.

Martin Company

What does it mean by “Martin programs”? The first line of the foreword of the manual says

This handbook has been produced by the Space Systems Division of the Martin Company under Contract NAS8-S03l with the George C. Marshall Space Flight Center of the National Aeronautics and Space Administration.

The Martin Company was the Glenn L. Martin Company, which became Martin Marietta after merging with American-Marietta Corporation in 1961. The handbook was written after the merger but used the older name. Martin Marietta would go on to become Lockheed Martin in 1995.

Bowie’s method was used “in many Martin programs” and yet is practically unknown in academic circles. Scarazzini’s thesis shows the method works well for his problem.

Nonlinear pendulum

My first thought when I saw the form of differential equations Bowie’s method solves was the nonlinear pendulum equation

y″ = − sin(y)

where the initial displacement y(0) is too large for the approximation sin θ ≈ θ to be sufficiently accurate. I wrote some Python code to try out Bowie’s method on this equation.

import numpy as np

N = 100
y  = np.zeros(N)
yp = np.zeros(N) # y'

y[0] = 1
yp[0] = 0

T = 4*ellipk(np.sin(y[0]/2)**2)
h = T/N

f   = lambda x: -np.sin(x)
fp  = lambda x: -np.cos(x) # f'
fpp = lambda x:  np.sin(x) # f''

for n in range(0, N-1):
    y[n+1] = y[n] + h*yp[n] + 0.5*h**2*f(y[n]) + \
              (h**3/6)*fp(y[n])*yp[n] + \
              (h**4/24)*(fpp(yp[n])*yp[n]**2 + fp(y[n])*f(y[n]))
    yp[n+1] = yp[n] + h*f(y[n]) + 0.5*h**2*fp(y[n])*yp[n] + \
              (h**3/6)*(fpp(yp[n])*yp[n]**2 + fp(y[n])*f(y[n]))

(Update: The code above was updated January 4, 2026 to fix a bug.)

Here’s a graph of the numerical solution.

The solution looks like a cosine, but it isn’t exactly. As I explain here,

The solution to the nonlinear pendulum equation is also periodic, though the solution is a combination of Jacobi functions rather than a combination of trig functions. The difference between the two solutions is small when θ0 is small, but becomes more significant as θ0 increases.

The difference in the periods is more evident than the difference in shape for the two waves. The period of the nonlinear solution is longer than that of the linearized solution.

That’s why the period T in the code is not

2π = 6.28

but rather

4 K(sin² θ0/2) = 6.70.

You’ll also see the period of the nonlinear pendulum given as 4 K(sin θ0/2). As pointed out in the article linked above,

There are two conventions for defining the complete elliptic integral of the first kind. SciPy uses a convention for K that requires us to square the argument.

Related posts

[1] Alex Scarazzini.3D Visualization of a Schwarzschild Black Hole Environment. University of Bern. August 2025.

The biggest perturbation of satellite orbits

To first approximation, a satellite orbiting the earth moves in an elliptical orbit. That’s what would get from solving the two-body problem: two point masses orbiting their common center of mass, subject to no forces other than their gravitational attraction to each other.

But the earth is not a point mass. Neither is a satellite, though that’s much less important. The fact that the earth is not exactly a sphere but rather an oblate spheroid is the root cause of the J2 effect.

The J2 effect is the largest perturbation of a satellite orbit from a simple elliptical orbit, at least for satellites in low earth orbit (LEO) and medium earth orbit (MEO). The J2 effect is significant for satellites in higher orbits, though third body effects are larger.

Legendre showed that the gravitational potential of an axially symmetric planet is given by

V(r, \phi) = \frac{Gm}{r} \left( 1 - \sum_{k=2}^\infty J_k  \left( \frac{r_{eq}}{r}\right)^k P_k(\cos \phi) \right)

Here (r, φ) are spherical coordinates. There’s no θ term because we assume the planet, and hence its gravitational potential, is axially symmetric, i.e. independent of θ. The term req is the equatorial radius of the planet. The Pk are Legendre polynomials.

For a moderately oblate planet, like the one we live on, the J2 coefficient is much larger than the others, and neglecting the rest of the coefficients gives a good approximation [1].

Here are the first few coefficients for Earth [2].

\begin{align*} J_2 &= \phantom{-}0.00108263 \\ J_3 &= -0.00000254 \\ J_4 &= -0.00000161 \end{align*}

Note that J2 is three orders of magnitude smaller than 1, and so the J2 effect is small. And yet it matters a great deal. The longitude of the point at which a satellite crosses the equatorial plane may vary a few degrees per day. The rate of precession is approximately proportional to J2.

The value of J2 for Mars is about twice that of Earth (0.001960454). The largest J2 in our solar system is Neptune, which is about three times that of Earth (0.003411).

There are many factors left out of the assumptions of the two body problem. The J2 effect doesn’t account for everything that has been left out, but it’s the first refinement.

More orbital mechanics posts

More Legendre posts

[1] Legendre discovered/invented what we now call the Legendre polynomials in the course of calculating the gravitational potential above. I assume the convention of using J for the coefficients goes back to Legendre.

[2] Richard H. Battin. An Introduction to the Mathematics and Methods of Astrodynamics, Revised Edition, 1999.