Just an approximation

I find it amusing when I hear someone say something is “just an approximation” because their “exact” answer is invariably “just an approximation” from someone else’s perspective. When someone says “mere approximation” they often mean “that’s not the kind of approximation my colleagues and I usually make” or “that’s not an approximation I understand.”

For example, I once audited a class in celestial mechanics. I was surprised when the professor spoke with disdain about some analytical technique as a “mere approximation” since his idea of “exact” only extended to Newtonian physics. I don’t recall the details, but it’s possible that the disreputable approximation introduced no more error than the decision to only consider point masses or to ignore relativity. In any case, the approximation violated the rules of the game.

Statisticians can get awfully uptight about numerical approximations. They’ll wring their hands over a numerical routine that’s only good to five or six significant figures but not even blush when they approximate some quantity by averaging a few hundred random samples. Or they’ll make a dozen gross simplifications in modeling and then squint over whether a p-value is 0.04 or 0.06.

The problem is not accuracy but familiarity. We all like to draw a circle around our approximation of reality and distrust anything outside that circle. After a while we forget that our approximations are even approximations.

This applies to professions as well as individuals. All is well until two professional cultures clash. Then one tribe will be horrified by an approximation another tribe takes for granted. These conflicts can be a great reminder of the difference between trying to understand reality and playing by the rules of a professional game.

Related posts

C programs and reading rooms

This evening I ran across Laurence Tratt’s article How can C Programs be so Reliable? Tratt argues that one reason is that C’s lack of a safety net makes developers more careful.

Because software written in C can fail in so many ways, I was much more careful than normal when writing it. In particular, anything involved in manipulating chunks of memory raises the prospect of off-by-one type errors – which are particularly dangerous in C. Whereas in a higher-level language I might be lazy and think hmm, do I need to subtract 1 from this value when I index into the array? Let’s run it and find out, in C I thought OK, let’s sit down and reason about this. Ironically, the time taken to run-and-discover often seems not to be much different to sit-down-and-think – except the latter is a lot more mentally draining.

I don’t know what I think of this, but it’s interesting. And it reminded me of something I’d written about this summer, how an acoustically live room can be quieter than a room that absorbs sound because people are more careful to be quiet in a live room. See How to design a quiet room.

Related post: Dynamic typing and anti-lock brakes

A Bayesian view of Amazon Resellers

I was buying a used book through Amazon this evening. Three resellers offered the book at essentially the same price. Here were their ratings:

  • 94% positive out of 85,193 reviews
  • 98% positive out of 20,785 reviews
  • 99% positive out of 840 reviews

Which reseller is likely to give the best service? Before you assume it’s the seller with the highest percentage of positive reviews, consider the following simpler scenario.

Suppose one reseller has 90 positive reviews out of 100. The other reseller has two reviews, both positive. You could say one has 90% approval and the other has 100% approval, so the one with 100% approval is better. But this doesn’t take into consideration that there’s much more data on one than the other. You can have some confidence that 90% of the first reseller’s customers are satisfied. You don’t really know about the other because you have only two data points.

A Bayesian view of the problem naturally incorporates the amount of data as well as its average. Let θA be the probability of a customer being satisfied with company A‘s service. Let θB be the corresponding probability for company B. Suppose before we see any reviews we think all ratings are equally likely. That is, we start with a uniform prior distribution θA and θB. A uniform distribution is the same as a beta(1, 1) distribution.

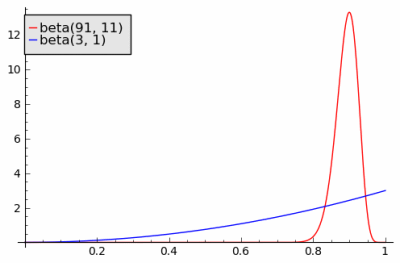
After observing 90 positive reviews and 10 negative reviews, our posterior estimate on θA has a beta(91, 11) distribution. After observing 2 positive reviews, our posterior estimate on θB has a beta(3, 1) distribution. The probability that a sample from θA is bigger than a sample from θB is 0.713. That is, there’s a good chance you’d get better service from the reseller with the lower average approval rating.

beta(91,11) versus beta(3,1)

Now back to our original question. Which of the three resellers is most likely to satisfy a customer?

Assume a uniform prior on θX, θY, and θZ, the probabilities of good service for each reseller. The posterior distributions on these variables have distributions beta(80082, 5113), beta(20370, 417), and beta(833, 9).

These beta distributions have such large parameters that we can approximate them by normal distributions with the same mean and variance. (A beta(a, b) random variable has mean a/(a+b) and variance ab/((a+b)2(a+b+1)).) The variable with the most variance, θZ, has standard deviation 0.003. The other variables have even smaller standard deviation. So the three distributions are highly concentrated at their mean values with practically non-overlapping support. And so a sample from θX or θY is unlikely to be higher than a sample from θZ.

In general, going by averages alone works when you have a lot of customer reviews. But when you have a small number of reviews, going by averages alone could be misleading.

Thanks to Charles McCreary for suggesting the xkcd comic.

Related links

Sed one-liners

A few weeks ago I reviewed Peteris Krumins’ book Awk One-Liners Explained. This post looks at his sequel, Sed One-Liners Explained.

The format of both books is the same: one-line scripts followed by detailed commentary. However, the sed book takes more effort to read because the content is more subtle. The awk book covers the most basic features of awk, but the sed book goes into the more advanced features of sed.

Sed One-Liners Explained provides clear explanations of features I found hard to understand from reading the sed documentation. If you want to learn sed in depth, this is a great book. But you may not want to learn sed in depth; the oldest and simplest parts of sed offer the greatest return on time invested. Since the book is organized by task — line numbering, selective printing, etc — rather than by language feature, the advanced and basic features are mingled.

On the other hand, there are two appendices  organized by language feature. Depending on your learning style, you may want to read the appendices first or jump into the examples and refer to the appendices only as needed.

For a sample of the book, see the table of contents, preface, and first chapter here.

Related links

California knows cancer

Last week I stayed in a hotel where I noticed this sign:

This building contains chemicals, including tobacco smoke, known to the State of California to cause cancer, birth defects, or other reproductive harm.

I saw similar signs elsewhere during my visit to California, though without the tobacco phrase.

The most amusing part of the sign to me was “known to the State of California.” In other words, the jury may still be out elsewhere, but the State of California knows what does and does not cause cancer, birth defects, and other reproductive harm.

Now this sign was not on the front of the hotel. You’d think that if the State of California knew that I faced certain and grievous harm from entering this hotel, they might have required the sign to be prominently displayed at the entrance. Instead, the sign was an afterthought, inconspicuously posted outside a restroom. “By the way, staying here will give you cancer and curse your offspring. Have a nice day.”

As far as the building containing tobacco smoke, you couldn’t prove it by me. I had a non-smoking room. I never saw anyone smoke in the common areas and assumed smoking was not allowed. But perhaps someone had once smoked in the hotel and therefore the public should be warned.

Related post: Smoking

New tech reports

Soft maximum

I had a request to turn my blog posts on the soft maximum into a tech report, so here it is:

Basic properties of the soft maximum

There’s no new content here, just a little editing and more formal language. But now it can be referenced in a scholarly publication.

More random inequalities

I recently had a project that needed to compute random inequalities comparing common survival distributions (gamma, inverse gamma, Weibull, log normal) to uniform distributions. Here’s a report of the results.

Random inequalities between survival and uniform distributions

This tech report develops analytical solutions for computing Prob(X > Y) where X and Y are independent, X has one of the distributions mentioned above, and Y is uniform over some interval. The report includes R code to carry out the analytic expressions. It also includes R code to estimate the same inequalities by sampling for complementary validation.

Here are some other tech reports and blog posts on random inequalities.

Professional volunteers

This afternoon I saw a fire truck with the following written on the side:

Staffed by professional volunteers

Of course this is an oxymoron if you take the words literally. A more accurate slogan would be

Staffed by well-qualified amateurs

A professional is someone who does a thing for money, and an amateur is someone who does it for love. Volunteer fire fighters are amateurs in the best sense, doing what they do out of love of the work and love for the community they serve.

Unfortunately professional implies someone is good at what they do, and amateur implies they are not. Maybe skill and compensation were more strongly correlated in the past. When most people had less leisure a century or two ago, few had the time to become highly proficient at something they were not paid for. Now the distinction is more fuzzy.

Because more people work for large organizations, public and private, it is easier to hide incompetence; market forces act more directly on the self-employed. It’s not uncommon to find people in large organizations who are professional only in the pecuniary sense.

It’s also more common now to find people who are quite good at something they choose not to practice for a living. I could imagine three ways the Internet may contribute to this.

  1. It makes highly skilled amateurs more visible by giving them an inexpensive forum to show their work.
  2. It gives amateurs access to information that would have once been readily available only to professionals.
  3. It has reduced the opportunities to make money in some professions. Some people give away their work because they can no longer sell it.

Big data and humility

One of the challenges with big data is to properly estimate your uncertainty. Often “big data” means a huge amount of data that isn’t exactly what you want.

As an example, suppose you have data on how a drug acts in monkeys and you want to infer how the drug acts in humans. There are two sources of uncertainty:

  1. How well do we really know the effects in monkeys?
  2. How well do these results translate to humans?

The former can be quantified, and so we focus on that, but the latter may be more important. There’s a strong temptation to believe that big data regarding one situation tells us more than it does about an analogous situation.

I’ve seen people reason as follows. We don’t really know how results translate from monkeys to humans (or from one chemical to a related chemical, from one market to an analogous market, etc.). We have a moderate amount of data on monkeys and we’ll decimate it and use that as if it were human data, say in order to come up with a prior distribution.

Down-weighting by a fixed ratio, such as 10 to 1, is misleading. If you had 10x as much data on monkeys, would you as much about effects in humans as if the original smaller data set were collected on people? What if you suddenly had “big data” involving every monkey on the planet. More data on monkeys drives down your uncertainty about monkeys, but does nothing to lower your uncertainty regarding how monkey results translate to humans.

At some point, more data about analogous cases reaches diminishing return and you can’t go further without data about what you really want to know. Collecting more and more data about how a drug works in adults won’t help you learn how it works in children. At some point, you need to treat children. Terabytes of analogous data may not be as valuable as kilobytes of highly relevant data.

More data science posts

Thomas Hardy and Harry Potter

Emily Willingham mentioned on Twitter that the names of the Harry Potter characters Dumbledore and Hagrid come from Thomas Hardy’s 1886 novel The Mayor of Casterbridge. Both appear in this passage:

One grievous failing of Elizabeth’s was her occasional pretty and picturesque use of dialect words …

… in time it came to pass that for “fay” she said “succeed”; that she no longer spoke of “dumbledores” but of “humble bees”; no longer said of young men and women that they “walked together,” but that they were “engaged”; that she grew to talk of “greggles” as “wild hyacinths”; that when she had not slept she did not quaintly tell the servants next morning that she had been “hag-rid,” but that she had “suffered from indigestion.”

Apparently dumbledore is a dialect variation on bumblebee and hagrid is a variation on haggard. I don’t know whether this is actually where Rowling drew her character names but it seems plausible.