Geometric derivation of hyperbolic trig functions

This is the third post in a series on generalizing sine and cosine.

The previous post looked at a generalization of the sine and cosine functions that come from replacing a circle with a lemniscate, a curve that looks like a figure eight. This post looks at replacing the circle with a hyperbola.

On the unit circle, an arc of length θ starting at (1, 0) and running counterclockwise ends at (cos θ, sin θ), and this can be used to define the two trig functions. The lemniscate functions use an analogous approach, transferring arc length to a new curve.

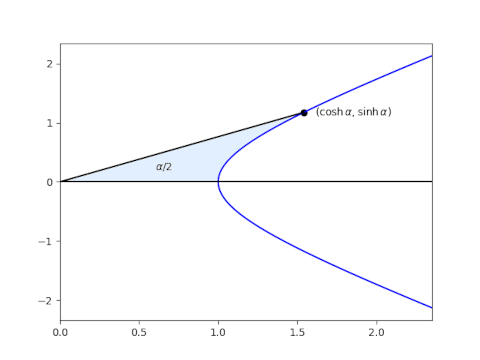
Hyperbolic functions do not do this. Instead, they generalize a different property of the circle. Again we start out at (1, 0) and move counterclockwise around the unit circle, but this time we look at area of the sector rather than the length of the arc. The sector that ends at (cos θ, sin θ) has area θ/2. We could define sine and cosine by this relation: cos α and sin α are the x and y coordinates of where we stop when we’ve swept out an area of θ/2. This would be an awkward way to define sine and cosine, but it generalizes.

Start at (1, 0) and move along the hyperbola x² – y² = 1 in the first quadrant until the area bounded by the hyperbola, the x-axis, and a line from the origin to your location (x, y) is α/2. Then the x and y coordinates of the place where you stop are cosh x and sinh x respectively.

This is interesting in its own right, but it is also useful to tie together the first post in this series and the next because it is the area generalization rather than the arc length generalization that gives a geometric interpretation to the functions sinp and cosp.

Lemniscate functions

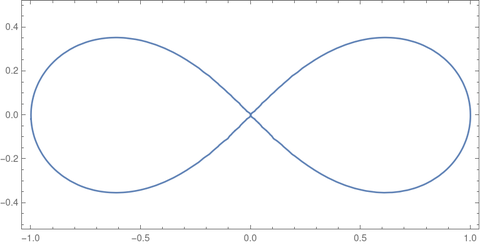
In the previous post I said that you could define the inverse sine as the function that gives the arc length along a circle, then define sine to be the inverse of the inverse sine. The purpose of such a backward definition is that it generalizes to other curves besides the circle. For example, it generalizes to the lemniscate, a curve studied by Bernoulli.

The leminiscate in rectangular coordinates satisfies

(x^2 + y^2)^2 = x^2 - y^2

and in polar coordinates

r^2 = \cos 2\theta

The function arcsl(x), analogous to arcsin(x), is defined as the length of the arc along the leminiscate from the origin to the point (x, y). The length of the arc from (x, y) to the x-axis is arccl(x).

\begin{align*} \mbox{arcsl}(x) &= \int_0^x \frac{dt}{\sqrt{1 - t^4}} \\ \mbox{arccl}(x) &= \int_x^1 \frac{dt}{\sqrt{1 - t^4}} \\ \end{align*}

The lemniscate sine, sl, is the inverse of arcsl, and the lemniscate cosine, cl, is the inverse of arccl. These functions were first studied by Giulio Fagnano three centuries ago.

The lemniscate functions sl and cl are elliptic functions, and so they have a lot of nice properties and satisfy a lot of identities. See Wikipedia, for example. Update: see this follow up post on addition theorems.

Lemniscate constant

As mentioned in the previous post, generalizations of the sine and cosine functions have corresponding generalizations of π.

Just as the period of sine and cosine is 2π, the period of lemninscate sine and lemniscate cosine is 2ϖ.

The number ϖ is called the lemniscate constant. It is written with Unicode character U+03D6, GREEK SMALL LETTER OMEGA PI. The LaTeX command command is \upvarpi.

The lemnmiscate constant ϖ is related to Gauss’ constant G by ϖ = πG.

The area of a squircle is √2 ϖ.

There is also a connection to the beta function: 2ϖ = B(1/4, 1/2).

Generalized trigonometry

In a recent post I mentioned in passing that trigonometry can be generalized from functions associated with a circle to functions associated with other curves. This post will go into that a little further.

The equation of the unit circle is

x^2 + y^2 = 1

and so in the first quadrant

y = \sqrt{1 - x^2}

The length of an arc from (1, 0) to (cos θ, sin θ) is θ. If we write the arc length as an integral we have

\int_0^{\sin \theta} (1 -t^2)^{-1/2} \,dt = \theta

and so

F(x) = \int_0^x (1 - t^2)^{-1/2} \,dt

is the inverse sine of x. Sine is the inverse of the inverse of sine, so we could define the sine function to be the inverse of F.

This would be a complicated way to define the sine function, but it suggests ways to create variations on sine: take the length of an arc along a curve other than the circle, and call the inverse of this function a new kind of sine. Or tinker with the integral defining F, whether or not the resulting integral corresponds to the length along a familiar curve, and use that to define a generalized sine.

Example: sinp

We can replace the 2’s in the integral above with p‘s, defining Fp as

F_p(x) = \int_0^x (1 - |t|^p)^{-1/p} \,dt

and defining sinp to be the inverse of Fp. When p = 2, sinp(x) = sin(x). This idea goes back to E. Lungberg in 1879.

The function sinp has its applications. For example, just as the sine function is an eigenfunction of the Laplacian, sinp is an eigenfunction of the p-Laplacian.

We can extend sinp to be a periodic function with period 4Fp(1). The constants πp are defined as 2Fp(1) so that sinp has period πp and π2 = π.

Future posts

I intend to explore several generalizations of sine and cosine. What happens if you replace a circle with an ellipse or a hyperbola? Or a squircle? How do these variations on sine and cosine compare to the originals? Do they satisfy analogous identities? How do they appear in applications? I’d like to address some of these questions in future posts.

From graph theory to category theory

Let G be a directed graph whose nodes are the positive integers and whose edges represent relations between two integers. In our first example we’ll draw an edge from x to y if x is a multiple of y. In our second example we’ll draw an edge from x to y if xy.

In both examples we define a function p(x, y) to be the unique node such that whenever a node z has directed edges going to x and to y, there is also a directed node from z to p(x, y).

Multiplication example

In this example there will be an edge from x to y if (and only if) x is a multiple of y. So, for instance, there is an edge from every even number to 2. There are edges from 15 to 1, 3, 5, and 15.

Now suppose there is some node with edges to 6 and 7. Call this node p(6, 7) or just p. Then p must be some multiple of 6 and 7. Also, by our definition of p we know that if there is an edge from any node z to 6 and 7, there must also be an edge from z to p. This says every multiple of 6 and 7 must also be a multiple of p. So p = 42. The node labeled z could be 4200, for example, but p can only be 42.

To generalize from this example, the node p(x, y) is the least common multiple of x and y.

Order example

In this example there will be an edge from x to y if and only if xy. Every positive integer points to itself and to every smaller integer.

Now what would p(x, y) be? It’s something no less than x and no less than y. And by definition of p, every number greater than p(x, y) is at least as big as p(x, y). That is, p(x, y) is the smallest integer no less than x or y, i.e. the maximum of x and y.

The reveal

The integer p(x, y) is the product of x and y in the sense of category theory. It may also be the product in the basic sense of multiplying two numbers together, but it might not be. The definition in terms of nodes and edges generalizes the notion of product, so that the familiar product is an example, the canonical example, but not the only example.

The category theory notion of a product abstracts something that multiplication and maximum have in common. More on this here.

We could go back and define a function c(x, y) by saying replacing “to” with “from” in the definition of p. That is, c(x, y) is the unique node such that whenever a node z has directed edges coming from x and from y, there is also a directed node to z coming from c(x, y). The function c is the coproduct.

Emphasizing the edges

In category theory, definitions, such as the definition of product and coproduct, depend not just on the objects but on the morphisms between them. In graph theory language, definitions depend not just on the nodes but also on the edges. Keep the same objects but define different morphisms and you get different products, as we did above.

Often there is a standard set of morphisms (edges), so standard that they are often left implicit. That’s usually OK, but sometimes the morphisms need to be emphasized, either because they are not the usual morphisms or because we need to stress some property of the morphisms. Morphisms are typically structure-preserving functions, and we may need to emphasize the structure-preserving part.

Test functions

Test functions are how you can make sense of functions that aren’t really functions.

The canonical example is the Dirac delta “function” that is infinite at the origin, zero everywhere else, and integrates to 1. That description is contradictory: a function that is 0 almost everywhere integrates to 0, even if you work in extended real numbers where a function can take on the value ∞.

You can make things like the delta function rigorous by saying they’re not functions of real numbers, but functions that operate on other functions, i.e. test functions. More on that here. These functions acting on test functions are called generalized functions or distributions. (This this post for how this kind of distribution differs from a probability distribution, but is analogous.)

Analogy with test charges

To say rigorously how these generalized functions behave you show how they act on test functions φ. Test functions are analogous to test charges: you can describe an electric field by saying what force it would exert on a test charge.

A test charge is somewhat idealized. It has to be so small that it tests a field without effecting it. This isn’t really possible, but you can think of it as a limit. You’re looking at the limit of the force per unit charge as the charge goes to zero.

Similarly, a test function is ideal in that it very well behaved so the generalized functions that act on it can be badly behaved. Test functions are infinitely differentiable, and they either have compact support or have extremely thin tails, depending on context.

Analogy with category theory

While writing the previous post I thought about an analogy between distribution theory and category theory. I worked with distribution theory a lot in grad school, and I found it natural that the definition of a distribution depended on how it acted in relation to something else, i.e. how it acted on all test functions.

But I found category definitions that involved extraneous objects puzzling. For example, the product of two objects is a third object such that for any fourth object (!) a certain diagram commutes. Why is this superfluous object doing injecting itself into the definition? If I’d thought of it as a test object then I would have found the definition more palatable.

As with distribution theory, you’re defining something by how it relates to all elements of some collection. But in distribution theory, your distributions and your test functions are very distinct things. In category theory, your test objects are peers of the thing you’re testing.

Groups vs Abelian groups: Pedantic or profound?

This article will probably only be of interest to a small number of readers. Those unfamiliar with category theory may find it bewildering, and those well versed in category theory may find it trivial. My hope is that someone in between, someone just starting to get a handle on category theory, will find it helpful. I wish I’d run across an article like this when I was in school.

My confusion

As a student I was confused by the inordinate stress on the distinction between general groups and Abelian groups. This seemed like a very simple thing that was being overemphasized. Does multiplication commute or not? If it does, you have an Abelian group; otherwise you do not. That’s all. And yet my professor seemed to think something deep was going on.

What I didn’t appreciate at the time is that there is something deep going on, not when you look at individual groups but when you look at kinds of groups collectively. That is, the category of general groups is quite different from the category of Abelian groups. This distinction was totally lost on me at the time.

Clarifying example

I ran across an exercise recently that pinpoints what I was missing. The exercise asks the reader to show that the product of two cyclic groups is a coproduct in the category of Abelian groups but it is not a coproduct in the category of groups.

Wrong perspective

Here’s how I would have thought about the problem at the time. The coproduct of two cyclic groups is their direct sum, and that’s the same group as the product. The coproduct is an Abelian group, so it’s a group, so it’s in the category of groups. So the statement in the exercise is wrong!

The exercise wasn’t wrong; the thinking above is wrong. But it’s wrong in a very subtle way.

In my mind, a category was a label that you put on things after you’ve done your calculations. This is a bear, it’s brown, so it’s a brown bear. What’s hard about that? What I was missing was the idea of a category as a working context, not just a classification label.

Right perspective

Products and coproducts are defined in the context of a category. That’s what I was missing. In my mind, the coproduct of two groups was defined in some operational way. But what I thought of as a definition was a theorem. The definition depends on the context of a category, the category of Abelian groups, and the thing defined in that context turns out to have the operational properties that I took to be the definition.

You can’t just carry out some calculation and ask what category your result lies in, because the definition of what you’re calculating depends on the context of the category.

In category theory, products and coproducts are defined by universal properties. The (co)product of two objects A and B in a category is defined by saying that something holds for every object C in the category. (More on this here.)

In the category of Abelian groups, we’re saying that something happens for every Abelian group, but not necessarily for every group. That’s why a coproduct in the category of Abelian groups may not be a coproduct in the category of all groups.

Supereggs, squigonometry, and squircles

The Depths of Wikipedia twitter account posted a screenshot about supereggs that’s popular at the moment. It says

there’s no way this is real. they must be making these words up

above a screenshot from the Wikipedia article on supereggs saying

The definition can be changed to have an equality rather than an inequality; this changes the superegg to being a surface of revolution rather than a solid.

I assume the Twitter account is having fun, not seriously suggesting that the terms are made up.

The terms “superegg” and “squircles” are whimsical but have been around for decades and have precise meanings. I hadn’t heard of “squigonometry,” but there are many variations on trigonometry that replace a circle with another curve, the best known example being hyperbolic trigonometry.

The equation for the volume of the superegg looked familiar but not quite right. It turns out the definition of superegg is not quite what I thought it was.

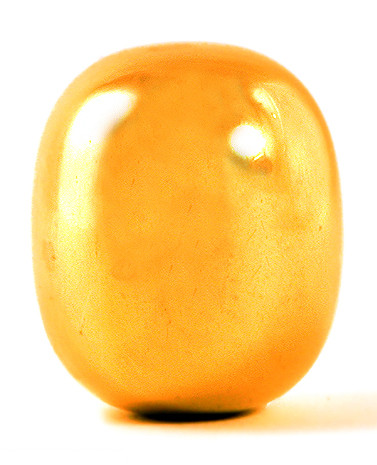
Brass superegg by Piet Hein

Piet Hein coined the terms superellipse and superegg. The photo above is a brass superegg made by Piet Hein [1].

A superellipse is what mathematicians more commonly call a p-norm ball in two dimensions. I assumed that a superegg was a p-norm ball in three dimensions, but it’s not quite.

A unit p-norm ball in 3 dimensions has equation

|x|^p + |y|^p + |z|^p = 1

A superegg, however, has equation

\left(\sqrt{x^2 + y^2}\right)^p + |z|^p = 1

If you slice a p-norm ball horizontally or vertically you get another p-norm ball. So in three dimensions, either a vertical or horizontal slice gives you a superellipse.

But a horizontal slice of a superegg is a circle while a vertical slice is a superellipse, which is not a circle unless p = 2. Said another way, supereggs are symmetric about the z-axis but p-norm balls are not.

I’ve left out one detail: superellipses and supereggs typically stretch one of the axes. So you’d replace x with x/k in the definition of a superellipse or replace z with z/k in the definition of a superegg. A squircle is a superellipse with the two axes equally, and typically p is set to 4 or a value near 4.

Related posts

[1] Photo by Malene Thyssen, licensed under the Creative Commons Attribution-Share Alike 3.0 Unported license.

Corny AI

Clippy

Meredith Whittaker posted on Twitter that

In addition to being the best in privacy, Signal is also the best in not subjecting you to corny ‘AI’ features no one asked for or wants.

I love the phrase “corny AI.” That’s exactly what a lot of AI features are.

“Would you like help composing that tweet?”

“No than you, I can write tiny text messages by myself.”

AI is the new Clippy.

I’m sure someone will object that these are early days, and AI applications will get better. That’s probably true, but they’re corny today. Inserting gimmicky, annoying technology now on the basis that future versions might be useful is like serving someone unripe fruit.

“This banana is hard and bitter!”

“Yes, but you should enjoy it because it would have been soft and sweet a few days from now.”

Of course not all AI is corny. For example, GPS has become reliable and unobtrusive. But there’s a rush to add AI just so a company can say their product includes AI. If the AI worked really well, the company would brag about how well the software works, not what technology it uses.


Today’s star

Exponential sum of the day 10/2/2023

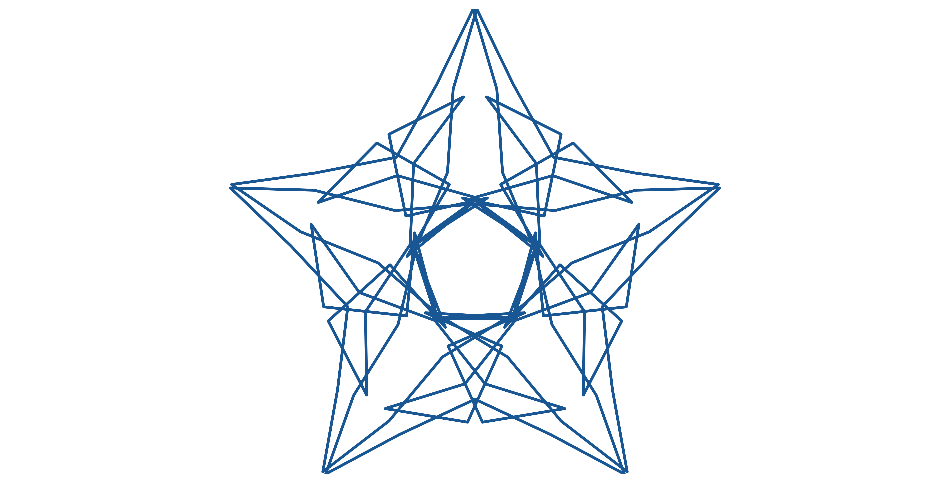
The star-like image above is today’s exponential sum.

The exponential sum page on my site generates a new image each day by putting the numbers of the day’s month, day, and year into the equation

\sum_{n=0}^N \exp\left( 2\pi i \left( \frac{n}{m} + \frac{n^2}{d} + \frac{n^3}{y} \right ) \right )

and connecting the partial sums in the complex plane. Here m is the month, d is the day, and y is the last two digits of the year.

Some people have asked why I use American date order: month, day, year. The flippant answer is I use American date order because I’m American. But I did experiment with other date orders, and I prefer the sequence of images produced by the order above. There’s more contrast between consecutive images by associating the day with the quadratic term rather than the linear term inside the exponential.

The exponential sum page is about six years old [1], and I still enjoy checking in on it each day. Short of making the plot, it’s not possible to imagine what an image will look like based on the date, other than the very rough rule that larger numbers tend to produce more complicated images. For example, images are much more intricate on New Year’s Eve than on New Year’s Day.

The images are often highly symmetric, as today’s image is. But occasionally they have no symmetry, as will be the case on 10/10/23.

The page lets you scroll back and forth by day, but you can put in any parameters you’d like by editing the page URL. For example, the link to today’s image is

   https://www.johndcook.com/expsum/?y=23&m=10&d=2

but you can change y, m, and d to any numbers you wish. There’s nothing that constrains m, for example, to be a number between 1 and 12. You could set it to 17 if you’d like. And although thirty days hath September, you can see what the image for September 31st would have looked like.

[1] The page was launched October 9, 2017, so its sixth anniversary is a week from today.

Consecutive coupon collector problem

Coupon collector problem

Suppose you have a bag of balls labeled 1 through 1,000. You draw balls one at a time and put them back after each draw. How many draws would you have to make before you’ve seen every ball at least once?

This is the coupon collector problem with N = 1000, and the expected number of draws is

N HN

where

HN = 1 + 1/2 + 1/3 + … + 1/N

is the Nth harmonic number.

As N increases, HN approaches log(N) + γ where γ = 0.577… is the Euler-Mascheroni constant, and so the expected time for the coupon collector problem is approximately

N (log(N) + γ).

Consecutive draws

Now suppose that instead of drawing single items, you draw blocks of consecutive items. For example, suppose the 1,000 balls are arranged in a circle. You pick a random starting point on the circle, then scoop up 10 consecutive balls, then put them back. Now how long would it take to see everything?

By choosing consecutive balls, you make it harder for a single ball to be a hold out. Filling in the holes becomes easier.

Bucketed problem

Now suppose the 1,000 balls are placed in 100 buckets and the buckets are arranged in a circle. Now instead of choosing 10 consecutive balls, you choose a bucket of 10 balls. Now you have a new coupon collector problem with N = 100.

This is like the problem above, except you are constraining your starting point to be a multiple of n.

Upper and lower bounds

I’ll use the word “scoop” to mean a selection of n balls at a time to avoid possible confusion over drawing individual balls or groups of balls.

If you scoop n balls at a time by making n independent draws, then you just have the original coupon collector problem, with the expected time divided by n.

If you scoop up n consecutively numbered balls each time, you reduce the expected time to see everything at least once. But your scoops can still overlap. For example, maybe you selected 13 through 22 on one draw, and 19 through 38 on the next.

In the bucketed problem, you reduce the expected time even further. Now your scoops will not partially overlap. (But they may entirely overlap, so it’s not clear that this reduces the total time.)

It would seem that we have sandwiched our problem between two other problems we have the solution to. The longest expected time would be if our scoop is made of n independent draws. Then the expected number of scoops is

N HN / n.

The shortest time is the bucketed problem in which the expected number of scoops is

(N/n) H(N/n).

It seems the problem of scooping n consecutive balls, with no constraint on the starting point, would have expected time somewhere between these two bounds. I say “it seems” because I haven’t proven anything here, just given plausibility arguments.

By the way, we can see how much bucketing reduces the expected time by using the log approximation above. With n independent draws each time, the expected number of scoops is roughly

(N/n) log(N)

whereas with the bucketed problem the expected number of scoops is roughly

(N/n) log(N/n).

Expected number of scoops

I searched a bit on this topic, and I found many problems with titles like “A variation on the coupon collector problem,” but none of the papers I found considered the variation I’ve written about here. If you work out the expected number of scoops, or find a paper where someone has worked this out, please let me know.

The continuous analog seems like an easier problem, and one that would provide a good approximation. Suppose you have a circle of circumference N and randomly place arcs of length n on the circle. What is the expected time until the circle is covered? I imagine this problem has been worked out many times and may even have a name.

Update: Thanks to Monte for posting links to the solution to the continuous problem in the comments below.

Simulation results

When N = 1000 and n = 10, the upper and lower bounds work out to 748 and 518.

When I simulated the consecutive coupon collector problem I got an average of 675 scoops, a little more than the average of the upper and lower bounds.