Product of normal PDFs

The product of two normal PDFs is proportional to a normal PDF. This is well known in Bayesian statistics because a normal likelihood times a normal prior gives a normal posterior. But because Bayesian applications don’t usually need to know the proportionality constant, it’s a little hard to find. I needed to calculate this constant, so I’m recording the result here for my future reference and for anyone else who might find it useful.

Denote the normal PDF by

\phi(x; m, s) = \frac{1}{\sqrt{2\pi} s} \exp\left(-\frac{(x-m)^2}{2s^2}\right)

Then the product of two normal PDFs is given by the equation

\phi(x; \mu_1, \sigma_1) \, \phi(x; \mu_2, \sigma_2) = \phi\left(\mu_1; \mu_2, \sqrt{\sigma_1^2 + \sigma_2^2}\right) \,\phi(x, \mu, \sigma)

where

 \mu = \frac{ \sigma_1^{-2} \mu_1 + \sigma_2^{-2} \mu_2}{\sigma_1^{-2} + \sigma_2^{-2} }

and

 \sigma^2 = \frac{\sigma_1^2 \sigma_2^2}{\sigma_1^2 + \sigma_2^2}

Note that the product of two normal random variables is not normal, but the product of their PDFs is proportional to the PDF of another normal.

Shifting probability distributions

One reason the normal distribution is easy to work with is that you can vary the mean and variance independently. With other distribution families, the mean and variance may be linked in some nonlinear way.

I was looking for a faster way to compute Prob(X > Y + δ) where X and Y are independent inverse gamma random variables. If δ were zero, the probability could be computed analytically. But when δ is positive, the calculation requires numerical integration. When the calculation is in the inner loop of a simulation, most of the simulation’s time is spent doing the integration.

Let Z = Y + δ. If Z were another inverse gamma random variable, we could compute Prob(X > Z) quickly and accurately without integration. Unfortunately, Z is not an inverse gamma. But it is approximately an inverse gamma, at least if Y has a moderately large shape parameter, which it always does in my applications. So let Z be inverse gamma with parameters to match the mean and variance of Y + δ. Then Prob(X > Z) is a good approximation to Prob(X > Y + δ).

For more details, see Fast approximation of inverse gamma inequalities.

More random inequality posts

Fast approximation of beta inequalities

A beta distribution has an approximate normal shape if its parameters are large, and so you could use normal approximations to compute beta inequalities. The corresponding normal inequalities can be computed in closed form.

This works surprisingly well. Even when the beta parameters are small and the normal approximation is a bad fit, the corresponding inequality approximation is pretty good.

For more details, see the tech report Fast approximation of beta inequalities.

Related post: Beta inequalities in R

How do you justify that distribution?

Someone asked me yesterday how people justify probability distribution assumptions. Sometimes the most mystifying assumption is the first one: “Assume X is normally distributed …” Here are a few answers.

  1. Sometimes distribution assumptions are not justified.
  2. Sometimes distributions can be derived from fundamental principles. For example, there are axioms that uniquely specify a Poisson distribution.
  3. Sometimes distributions are justified on theoretical grounds. For example, large samples and the central limit theorem together may justify assuming that something is normally distributed.
  4. Often the choice of distribution is somewhat arbitrary, chosen by intuition or for convenience, and then empirically shown to work well enough.
  5. Sometimes a distribution can be a bad fit and still work well, depending on what you’re asking of it.

The last point is particularly interesting. It’s not hard to imagine that a poor fit would produce poor results. It’s surprising when a poor fit produces good results. Here’s an example of the latter.

Suppose you are testing a new drug and hoping that it improves how long patients live. You want to stop the clinical trial early if it looks like patients are living no longer than they would have on standard treatment. There is a Bayesian method for monitoring such experiments that assumes survival times have an exponential distribution. But survival times are not exponentially distributed, not even close.

The method works well because of the question being asked. The method is not being asked to accurately model the distribution of survival times for patients in the trial. It is only being asked to determine whether a trial should continue or stop, and it does a good job of doing so. Simulations show that the method makes the right decision with high probability, even when the actual survival times are not exponentially distributed.

More probability posts

Vague priors are informative

Data analysis has to start from some set of assumptions. Bayesian prior distributions drive some people crazy because they make assumptions explicit that people prefer to leave implicit. But there’s no escaping the need to make some sort of prior assumptions, whether you’re doing Bayesian statistics or not.

One attempt to avoid specifying a prior distribution is to start with a “non-informative” prior. David Hogg gives a good explanation of why this doesn’t accomplish what some think it does.

In practice, investigators often want to “assume nothing” and put a very or infinitely broad prior on the parameters; of course putting a broad prior is not equivalent to assuming nothing, it is just as severe an assumption as any other prior. For example, even if you go with a very broad prior on the parameter a, that is a different assumption than the same form of very broad prior on a2 or on arctan(a). The prior doesn’t just set the ranges of parameters, it places a measure on parameter space. That’s why it is so important.

More posts on Bayesian statistics

Avoiding underflow in Bayesian computations

Here’s a common problem that arises in Bayesian computation. Everything works just fine until you have more data than you’ve seen before. Then suddenly you start getting infinite, NaN, or otherwise strange results. This post explains what might be wrong and how to fix it.

A posterior density is (proportional to) a likelihood function times a prior distribution. The likelihood function is a product. The number of data points is the number of terms in the product. If these numbers are less than 1, and you multiply enough of them together, the result will be too small to represent in a floating point number and your calculation will underflow to zero. Then subsequent operations with this number, such as dividing it by another number that has also underflowed to zero, may produce an infinite or NaN result.

The instinctive reaction regarding underflow or overflow is to use logs. And often that works. If you wanted to know where the maximum of the posterior density occurs, you could find the maximum of the logarithm of the posterior density. But in Bayesian computations you often need to integrate the posterior density times some functions. Now you cannot just work with logs because logs and integrals don’t commute.

One way around the problem is to multiply the integrand by a constant so large that there is no danger of underflow. Multiplying by constants does commute with integration.

So suppose your integrand is on the order of 10^−400, far below the smallest representable number. Do you need extended precision arithmetic? No, you just need to understand your problem.

If you multiply your integrand by 10^400 before integrating, then your integrand is roughly 1 in magnitude. Then do you integration, and remember that the result is 10^400 times the actual value.

You could take the following steps.

  1. Find m, the maximum of the log of the integrand.
  2. Let I be the integral of exp( log of the integrand − m ).
  3. Keep track that your actual integral is exp(m) I, or that its log is m + log I.

Note that you can be extremely sloppy in this process. You don’t need an accurate estimate of the maximum of the integrand per se. If you’re within a few dozen orders of magnitude, for example, that could be sufficient to carry out your integration without underflow.

One way to estimate the maximum is to use a frequentist estimator of your parameters as an approximate MLE, and assume that this is approximately where your posterior density takes on its maximum value. This might actually be very accurate, but it doesn’t need to be.

Note also that it’s OK if some of the evaluations of your integrand underflow to zero. You just don’t want the entire integral to underflow to zero. Places where the integrand is many orders of magnitude less than its maximum don’t contribute to the integration anyway. (It’s important that your integration pays attention to the region where the integrand is largest. A naive integration could entirely miss the most important region and completely underestimate the integral. But that’s a matter for another blog post.)

Monkeying with Bayes’ theorem

In Peter Norvig’s talk The Unreasonable Effectiveness of Data, starting at 37:42, he describes a translation algorithm based on Bayes’ theorem. Pick the English word that has the highest posterior probability as the translation. No surprise here. Then at 38:16 he says something curious.

So this is all nice and theoretical and pure, but as well as being mathematically inclined, we are also realists. So we experimented some, and we found out that when you raise that first factor [in Bayes’ theorem] to the 1.5 power, you get a better result.

In other words, if we change Bayes’ theorem (!) the algorithm works better. He goes on to explain

Now should we dig up Bayes and notify him that he was wrong? No, I don’t think that’s it. …

I imagine most statisticians would respond that this cannot possibly be right. While it appears to work, there must be some underlying reason why and we should find that reason before using an algorithm based on an ad hoc tweak.

While such a reaction is understandable, it’s also a little hypocritical. Statisticians are constantly drawing inference from empirical data without understanding the underlying mechanisms that generate the data. When analyzing someone else’s data, a statistician will say that of course we’d rather understand the underlying mechanism than fit statistical models, that’s just not always possible. Reality is too complicated and we’ve got to do the best we can.

I agree, but that same reasoning applied at a higher level of abstraction could be used to accept Norvig’s translation algorithm. Here’s this model (derived from spurious math, but we’ll ignore that). Let’s see empirically how well it works.

The universal solvent of statistics

Andrew Gelman just posted an interesting article on the philosophy of Bayesian statistics. Here’s my favorite passage.

This reminds me of a standard question that Don Rubin … asks in virtually any situation: “What would you do if you had all the data?” For me, that “what would you do” question is one of the universal solvents of statistics.

Emphasis added.

I had not heard Don Rubin’s question before, but I think I’ll be asking it often. It reminds me of Alice’s famous dialog with the Cheshire Cat:

“Would you tell me, please, which way I ought to go from here?”

“That depends a good deal on where you want to get to,” said the Cat.

“I don’t much care where–” said Alice.

“Then it doesn’t matter which way you go,” said the Cat.

Cheshire Cat

Related post: Irrelevant uncertainty

Six analysis and probability diagrams

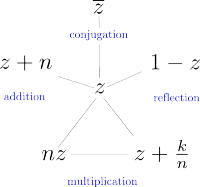
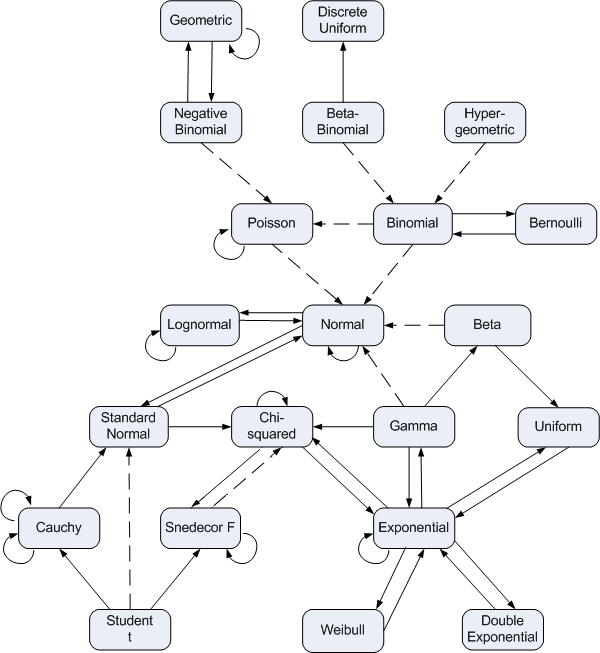
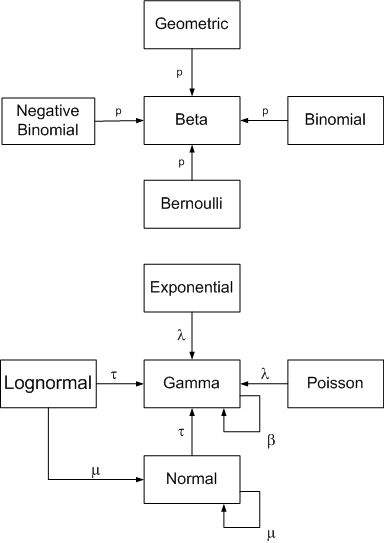
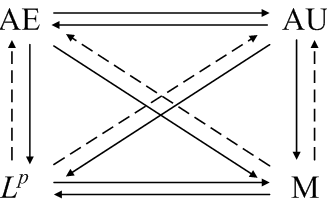
Here are a few diagrams I’ve created that summarize relationships in analysis and probability. Click on a thumbnail image to go to a page with the full image and explanatory text.

Special functions

Gamma and related functions

Probability distributions

Conjugate priors

Convergence theorems

Bessel functions


Related: Visualizing category theory concept dependencies

Interpreting statistics

From Matt Briggs:

I challenge you to find me in any published statistical analysis, outside of an introductory textbook, a confidence interval given the correct interpretation. If you can find even one instance where the [frequentist] confidence interval is not interpreted as a [Bayesian] credible interval, then I will eat your hat.

Most statistical analysis is carried out by people who do not interpret their results correctly. They carry out frequentist procedures and then give the results a Bayesian interpretation. This is not simply a violation of an academic taboo. It means that people generally underestimate the uncertainty in their conclusions.

More statistical posts