How loud is the evidence?

We sometimes speak of data as if data could talk. For example, we say such things as “What do the data say?” and “Let the data speak for themselves.” It turns out there’s a way to take this figure of speech seriously: Evidence can be meaningfully measured in decibels.

In acoustics, the intensity of a sound in decibels is given by

10 log10(P1/P0)

where P1 is the power of the sound and P0 is a reference value, the power in a sound at the threshold of human hearing.

In Bayesian statistics, the level of evidence in favor of a hypothesis H1 compared to a null hypothesis H0 can be measured in the same way as sound intensity if we take P0 and P1 to be the posterior probabilities of hypotheses H0 and H1 respectively.

Measuring statistical evidence in decibels provides a visceral interpretation. Psychologists have found that  human perception of stimulus intensity in general is logarithmic. And while natural logarithms are more mathematically convenient, logarithms base 10 are easier to interpret.

A 50-50 toss-up corresponds to 0 dB of evidence. Belief corresponds to positive decibels, disbelief to negative decibels. If an experiment shows H1 to be 100 times more likely than H0 then the experiment increased the evidence in favor of H1 by 20 dB.

A normal conversation is about 60 acoustic dB. Sixty dB of evidence corresponds to million to one odds. A train whistle at 500 feet produces 90 acoustic dB. Ninety dB of evidence corresponds to billion to one odds, data speaking loudly indeed.

To read more about evidence in decibels, see Chapter 4 of Probability Theory: The Logic of Science.

Good, fast, or cheap: Can you really pick two?

There’s a saying that clients can have good, fast, or cheap. Pick two, but then the third will be whatever it has to be based on the other two choices. You can have good and fast if you’re willing to spend a lot of money. You can have fast and cheap, but the quality will be poor. You might even be able to get good and cheap, if you’re willing to wait a long time.

A variation on this theme is the iron triangle. You draw a triangle with vertices labeled “features”, “time” and “resources.” If you make two of the sides longer, the third has to become longer too. Here goodness is defined as a feature set rather than quality, but the same principle applies.

There’s a problem with this line of reasoning: no matter what clients say, they want quality. They may say they want fast and cheap, and if you tell them you’ll sacrifice quality to deliver fast and cheap, you’ll be a hero — until you deliver. Then they want quality. As Howard Newton put it

People forget how fast you did a job, but they remember how well you did it.

Sometimes you can cut features as long as you do a good job on the features that remain, but only to a point. Clients are not going to be happy unless you meet their expectations, even if those expectations are explicitly contradicted in a contract. You can tell a client you’ll cut out frills to give them something fast and cheap, and they’ll gladly agree. But they still want their frills, or they will want them. The client may be silently disappointed. Or they may be vocally disappointed, demanding excluded features for free and complaining about your work. Eventually you learn what features to insist on including, even if a client says they can live without them.

Math and stat posts classified

I’ve added a page to my website where I classified my blog posts and informal articles on math and statistics into six categories:

  • Elementary
  • Preventing and detecting errors
  • Interpreting and misinterpreting probabilities
  • Mathematical statistics
  • Practicalities
  • Pure math

I’ve put a link to this page on the side of my blog and intend to keep it up as I add posts related to math and statistics.

Tukey tallying

John Tukey was amazingly talented. He would have been remembered for his achievements in pure mathematics had he not gone on to have an even more remarkable career in statistics. He is also remembered for some of the words he coined, such as “software” and “vacuum cleaner.”

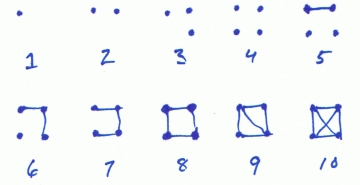
In his book Exploratory Data Analysis, affectionately known as EDA, Tukey gives advice on collecting and analyzing data, even down to how to count observations. Rather than the usual slash tallying, Tukey recommended his own method of tallying.

Tukey's tally system

Tukey’s system is easier to scan and may be less error-prone. For example, compare a count of 36 in both systems.

36 in slash tally

36 in Tukey tally

How to linearize data for regression

Linear regression books usually include a footnote that you might have to transform your data before you can apply regression. However, they seldom give any guidance on how to pick a transformation. Just try something until your scatterplots look linear.

John Tukey gave a nice heuristic for linearizing data in his 1977 book Exploratory Data Analysis. Tukey gives what he calls a ladder of transformations.

y3
y2
y
y
log y
y-1
y-2
y-3

Try transformations in the direction of the bulge in the plot.  If the plot bulges up (say your plot looks something like y=√x), then move up the ladder from the identity: try squaring or cubing the data. Or if you’re going to transform x, think of the ladder as horizontal, from x3 to –x-3. If the bulge is down and to the right, either move down the y-ladder or to the right on the x-ladder.

(If you know of a good presentation of this topic online, something with good illustrations, please let me know and I’ll link to it. I did a quick search and found several hits, but the ones I looked at lacked clear pictures.)

Related: Applied linear regression

Someone else’s cells

You probably have someone else’s cells growing inside you.

In a phenomena known as microchimerism, mothers pass some of their cells onto their children, and vice versa, during pregnancy. That’s not too surprising in itself. What is more surprising is that these cells can reproduce for decades. It’s not uncommon to find female cells in a grown man, or male cells in a woman who gave birth to a son.

See “Your Cells Are My Cells” in Scientific American, February 2008.

C-state and F-state

Edward Hallowell coined two great terms in his book Crazy Busy: C-state and F-state

C-state is clear, calm, cool, collected, consistent, concentrated, convivial, careful, curious, creative, courteous, and coordinated.

F-state fractures focus, is frenzied, feckless, flailing, fearful, forgetful, flustered, furious, fractious, feverish, and frantic.

Multitasking leads to F-state and activates different parts of the brain than C-state. Just giving F-state a name and being aware of it helps to back out of it.

Probability and information

E. T. Jaynes gave a speech entitled A Backward Look to the Future in which he looked back on his long career as a physicist and statistician. The speech contains several quotes related to my recent post on what a probability means.

Jaynes advocated the view of probability theory as logic extended to include reasoning on incomplete information. Probability need not have anything to do with randomness. Jaynes believed that frequency interpretations of probability are unnecessary and misleading.

… think of probability theory as extended logic, because then probability
distributions are justified in terms of their demonstrable information content, rather than their imagined—and as it now turns out, irrelevant—frequency connections.

He concludes with this summary of his approach to probability.

As soon as we recognize that probabilities do not describe reality—only our information about reality—the gates are wide open to the optimal solution of problems of reasoning from that information.

Related: Using information theory to clarify and quantify

Cutting and pasting Turing

Charles Petzold describes on his blog how he wrote his book The Annotated Turing, a commentary on Alan Turing‘s seminal computer science paper. The book is scheduled to be released June 10. Petzold began by literally cutting and pasting pieces of Turing’s paper. He worked on the book away from his computer for the first couple months.

As a programmer and author, Petzold has no aversion to using computers. He says “I gave up handwriting … sometime around 1982 when I first learned WordStar on my Osborne 1.” But he discovered that he thought more deeply about the subject of his book when he wasn’t distracted by typesetting issues. He’s a technical wizard, but he makes selective use of technology.