Why would you want to plot a mathematical function using a drawing package like Inkscape rather than a mathematical package like Mathematica or R? One reason is that you may want plot for its visual properties. For example, you might want to include a sine wave in a drawing.
Another reason is that you may want to have more control (or at least easier control) over your plot. Mathematical packages make it easy to produce a basic plot with default options. But I’ve found it difficult to change the aesthetics of a plot in every mathematical package I’ve used. The things I want to do are often possible but require arcane options that I have trouble remembering. In a drawing program, it’s obvious how to manipulate a plot as an image.

Inkscape provides a couple extensions to include function plots in a drawing. One is “Function Plotter” and the other is “Parametric Curves.” Both are found under Extensions -> Render. The following dialog shows the settings used to produce the graph above.
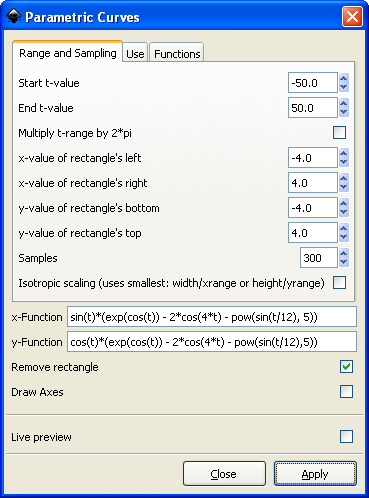
The first time I tried using these extensions nothing happened. Then I discovered you have to select a rectangle to contain the plot before creating a plot; the plotting tools do not create their own rectangles.
The Function Plotter supports rectangular and polar coordinates. You’re in for quite a surprise if you expect rectangular coordinates when the polar coordinates box is checked.