Deleting reproducible files in Emacs dired

Imagine you could list the contents of a directory from a command line, and then edit the text output to make things happen. That’s sorta how Emacs dired works. It’s kind of a cross between a bash shell and the Windows File Explorer. Why would you ever want to use such a bizarre hybrid?

One reason is to avoid context switching. If you’re editing a file, you can pop over to a new buffer that is your file manager, do what you need to do, then pop back, all without ever leaving Emacs.

Another reason is that, as with everything else in Emacs, it’s all text. Everything in Emacs is just text, and so the same editing commands can be used everywhere. (More on that here.)

Even though I use Emacs daily, and even though I can make a case for why dired is great, I don’t use it that much. Or rather, I don’t use that much of what it can do. The good that I would, I do not.

I was reviewing dired‘s features and discovered something very handy: typing %& will mark files for deletion that can easily be created again. In particular, it will flag the byproducts of compiling a LaTeX file.

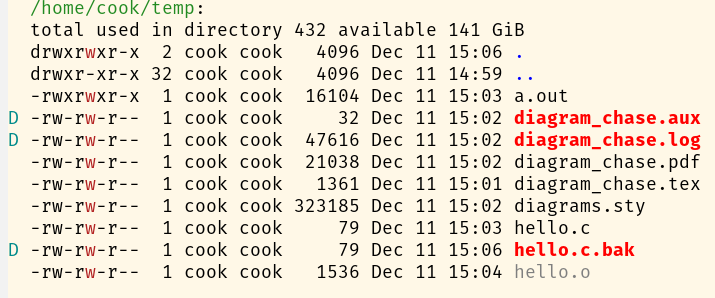
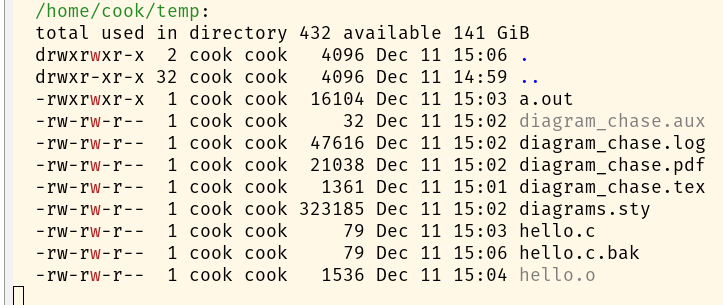
For example, the following is a screenshot of a dired buffer.

When I type %& it highlights the LaTeX temp files in red and marks them for deletion. (The D’s in the left column indicate files to be deleted.)

This doesn’t delete the files, but it marks them for deletion. If I then type x the files will be deleted.

In addition to the unneeded LaTeX files, it also highlighted a .bak file. However, it did not highlight the .o object file. I suppose the thought was that most people would manage C programs from a make file. I’m sure the class of files to mark is configurable, like everything else in Emacs.

More Emacs posts

Fraud, Sloppiness, and Statistics

A few years ago the scientific community suddenly realized that a lot of scientific papers were wrong. I imagine a lot of people knew this all along, but suddenly it became a topic of discussion and people realized the problem was bigger than imagined.

The layman’s first response was “Are you saying scientists are making stuff up?” and the response from the scientific community was “No, that’s not what we’re saying. There are subtle reasons why an honest scientist can come to the wrong conclusion.” In other words, don’t worry about fraud. It’s something else.

Well, if it’s not fraud, what is it? The most common explanations are sloppiness and poor statistical practice.

Sloppiness

The sloppiness hypothesis says that irreproducible results may be the result of errors. Or maybe the results are essentially correct, but the analysis is not reported in sufficient detail for someone to verify it. I first wrote about this in 2008.

While I was working for MD Anderson Cancer Center, a couple of my colleagues dug into irreproducible papers and tried to reverse engineer the mistakes and omissions. For example, this post mentioned some of the erroneous probability formulas that were implicitly used in journal articles.

Bad statistics

The bad statistics hypothesis was championed by John Ioannidis in his now-famous paper Most published research findings are false. The article could have been titled “Why most research findings will be false, even if everyone is honest and careful.” For a cartoon version of Ioannidis’s argument, see xkcd’s explanation of why jelly beans cause acne. In a nutshell, the widespread use of p-values makes it too easy to find spurious but publishable results.

Ioannidis explained that in theory most results could be false, based on statistical theory, but potentially things could be better in practice than in theory. Unfortunately they are not. Numerous studies have tried to empirically estimate [1] what proportion of papers cannot be reproduced. The estimate depends on context, but it’s high.

For example, ScienceNews reported this week on an attempt to reproduce 193 experiments in cancer biology. Only 50 of the experiments could be reproduced, and of those, the reported effects were found to be 85% smaller than initially reported. Here’s the full report.

Fraud

This post started out by putting fraud aside. In a sort of a scientific version of Halnon’s razor, we agreed not to attribute to fraud what could be adequately explained by sloppiness and bad statistics. But what about fraud?

There was a spectacular case of fraud in The Lancet last year.

article summary with RETRACTED stamped on top in red

The article was published May 22, 2020 and retracted on June 4, 2020. I forget the details, but the fraud was egregious. For example, if I remember correctly, the study claimed to have data on more than 100% of the population in some regions. Peer review didn’t catch the fraud but journalists did.

Who knows how common fraud is? I see articles occasionally that try to estimate it. But exposing fraud takes a lot of work, and it does not advance your career.

I said above that my former colleagues were good at reverse engineering errors. They also ended up exposing fraud. They started out trying to figure out how Anil Potti could have come to the results he did, and finally determined that he could not have. This ended up being reported in The Economist and on 60 Minutes.

As Nick Brown recently said on Twitter,

At some point I think we’re going to have to accept that “widespread fraud” is both a plausible and parsimonious explanation for the huge number of failed replications we see across multiple scientific disciplines.

That’s a hard statement to accept, but that doesn’t mean it’s wrong.

[1] If an attempt to reproduce a study fails, how do we know which one was right? The second study could be wrong, but it’s probably not. Verification is generally easier than discovery. The original authors probably explored multiple hypotheses looking for a publishable result, while the replicators tested precisely the published hypothesis.

Andrew Gelman suggested a thought experiment. When a large follow-up study fails to replicate a smaller initial study, image if the timeline were reversed. If someone ran a small study and came up with a different result than a previous large study, which study would have more credibility?

Comparing three discrete power laws

Yesterday I wrote about the zeta distribution and the Yule-Simon distribution and said that they, along with the Zipf distribution, are all discrete power laws. This post fills in detail for that statement.

The probability mass functions for the zeta, Zipf, and Yule-Simon distributions are as follows.

\begin{align*} f_\zeta(k; s) &= k^{-s} / \zeta(s) \\ f_y(k; \rho) &= \rho B(k, \rho+1) \\ f_z(k; N, s) &= k^{-s} / H_{N,s} \end{align*}

Here the subscripts ζ, y, and z stand for zeta, Yule, and Zipf respectively. The distribution parameters follow after the semicolon.

Comparing Zipf and zeta

The Zipf distribution is only defined on the first N positive integers. The normalizing constant for the Zipf distribution is the Nth generalized harmonic number with exponent s.

H_{N,s} = \sum_{k=1}^N k^{-s}

As N goes to infinity, HN,s converges to ζ(s); this is the definition of the ζ function. So the Zipf and zeta distributions are asymptotically equal.

Comparing zeta and Yule

This post showed that for large k,

f_y(k; \rho) \approx \rho \Gamma(\rho + 1) \frac{1}{(k+\rho)^{\rho + 1}}

That is, fy(k, ρ) is proportional to a power of k, except k is shifted by an amount ρ.

To compare the zeta and Yule distributions we’ll need to compare zeta with s+1 to Yule with ρ in order to make the exponents agree, and we’ll need to shift the zeta distribution by s+1.

When we plot the ratio of the pmfs, we see that the distributions agree in the limit as k gets large.

In this plot s = ρ = 1.5.

The ratio is approaching a constant, and in fact the limit is

\frac{1}{ \rho \,\Gamma(\rho + 1)\,\zeta(s+1)}

based on the ratio of the proportionality constants.

Comment

Note that the three distributions are asymptotically proportional, given the necessary shift in k, but in different ways. The Zipf distribution converges to the zeta distribution, for every k, as N goes to infinity. The zeta and Yule distributions are asymptotically proportional as k goes to infinity. So one proportion is asymptotic in a parameter N and one is asymptotic in an argument k.

The zeta distribution

The previous post on the Yule-Simon distribution mentioned the zeta distribution at the end. This is a powerlaw distribution on the positive integers with normalizing constant given by the Riemann zeta distribution. That is, the zeta distribution has density

f(k; s) = ks / ζ(s).

where k is a positive integer and s > 1 is a fixed parameter.

For s > 1, the zeta function is defined as the sum of the positive integers to the power negative s, so ζ(s) is essentially defined as the normalizing constant of the zeta distribution.

I wanted to make a couple comments about this. First, it shows that the zeta function appears in applications outside of number theory. Second, when working with the zeta distribution, it would be useful to have an estimate for ζ(s).

Zeta function bounds

The integral test in calculus is typically presented as a way to test whether an infinite sum converges. This is a shame. In analysis as in statistics, estimation is better than testing. Testing throws away continuous information and replaces it with a single bit.

Let f(x) be a decreasing function; we have in mind f(x) = 1/xs. Then for any n,

\int_{n+1}^\infty f(x)\, dx \leq \sum_{k = n+1}^\infty f(k) \leq \int_{n}^\infty f(x)\, dx

To estimate a sum over k, we sum the first n terms directly and apply the inequalities above for the rest. Typically n will be small, maybe 0 or 1. A larger value of n will give more accurate bounds but at the expense of a more complicated expression.

When f(x) = 1/xs and n is at least 1, we have

\frac{(n+1)^{1-s}}{s-1} \leq \sum_{k = n+1}^\infty f(k) \leq \frac{n^{1-s}}{s-1}

This says

\sum_{k=1}^n k^{-s} + \frac{(n+1)^{1-s}}{s-1} \leq \zeta(s) \leq \sum_{k=1}^n k^{-s} + \frac{n^{1-s}}{s-1}

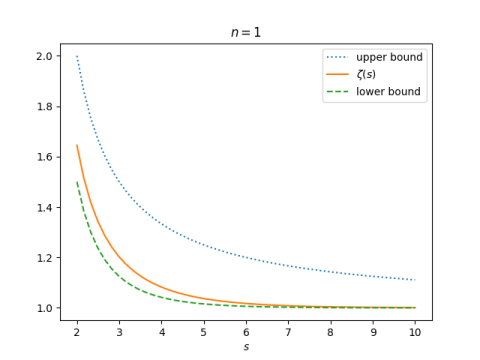
This gives a good lower bound but a bad upper bound when we choose n = 1.

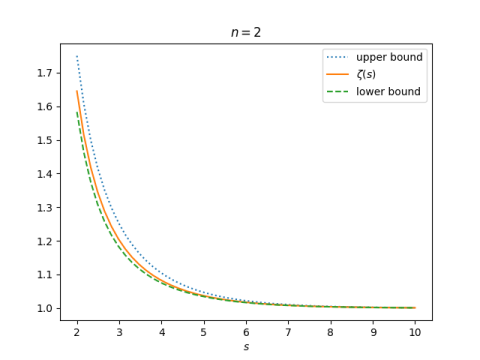
But it gives a much better upper bound when we choose n = 2.

Related posts

Yule-Simon distribution

The Yule-Simon distribution, named after Udny Yule and Herbert Simon, is a discrete probability with pmf

f(k; \rho) = \rho B(k, \rho + 1)

The semicolon in f(k; ρ) suggests that we think of f as a function of k, with a fixed parameter ρ. The way the distribution shows the connection to the beta function, but for our purposes it will be helpful to expand this function using

B(x, y) = \frac{\Gamma(x) \, \Gamma(y)}{\Gamma(x+y)}

and so

\begin{align*} f(k; \rho) &= \rho B(k, \rho + 1) \\ &= \rho \Gamma(\rho + 1) \,\,\frac{\Gamma(k)}{\Gamma(k + \rho + 1)} \\ &= \rho \Gamma(\rho + 1) \,\, \frac{1}{(k + \rho)^{\underline{\rho + 1}}} \end{align*}

Ignore the first part of the last line, ρ Γ(ρ + 1), because it doesn’t involve k. It helps to ignore proportionality constants in probability densities when they’re not necessary. What’s left is the (ρ + 1) falling power of k + ρ.

For large values of k, the falling power term is asymptotically equal to kρ+1. To see this, let k = 1000 and ρ = 3. Then we’re saying that the ratio of

1003 × 1002 × 1001 × 1000

to

1000 × 1000 × 1000 × 1000

is approximately 1, and the ratio converges 1 as k increases.

This says that the Yule-Simon distribution is a power law in the tails, just like the Zipf distribution and the zeta distribution. Details of the comparison between these three distributions are given here.

Related posts

Mahalanobis distance and Henry V

I was reading a stats book that mentioned Mahalanobis distance and that made me think of Non Nobis from Henry V, a great scene in a great movie. As far as I know, there’s no connection between Mahalanobis and Non Nobis except that both end in “nobis.”

Since Mahalanobis is an Indian surname and Non Nobis is Latin, there’s probably no etymological connection between the two except maybe way back in Indo-European.

Mahalanobis distance is Euclidean distance adapted to a multivariate normal distribution. Specifically, the squared distance between two column vectors x and y is

(xy)T S-1 (xy)

where S is the covariance matrix for a multivariate Gaussian distribution.

You might look at this and ask why the matrix in the middle has to be the inverse of a covariance matrix. Couldn’t it be any invertible matrix? Isn’t this just Euclidean distance in transformed coordinates? Yes and yes. But Mahalanobis thought of how to use it in statistics.

Mahalanobis’ birthday, June 29, is National Statistics Day in India in his honor.

Probability of a magical permutation

Take a permutation of the numbers 1 through n² and lay out the elements of the permutation in a square. We will call a permutation a magic permutation if the corresponding square is a magic square. What is the probability that a permutation is a magic permutation? That is, if you fill a grid randomly with the numbers 1 through n², how likely are you to get a magic square?

For example, we could generate a random permutation in Python and see whether it forms a magic square.

>>> import numpy as np
>>> np.random.permutation(9).reshape(3,3)
array([[4, 7, 3],
       [2, 6, 5],
       [8, 0, 1]])

The first row adds up to 14 and the second row adds up to 13, so this isn’t a magic square. We could write a script to do this over and over and check whether the result is a magic square.

The exact number of magic squares of size n is known for n up to 5, and we have Monte Carlo estimates for larger values of n.

The number of unique magic squares, modulo rotations and reflections, of size 1 through 5 is

1, 0, 1, 880, 275305224.

For n > 2 the total number of magic squares, counting rotations and reflections as different squares, is 8 times larger than the numbers above. This is because the group of rotations and reflections of a square, D4, has 8 elements.

The probability that a permutation of the numbers 1 through 9, arranged in a square, gives a magic square is 8/9!. The corresponding probability for the numbers 1 through 16 is 8 × 880/16!, and for the numbers 1 through 25 we have 8 × 275305224/25!.

    |---+-------------|
    | n | Prob(magic) |
    |---+-------------|
    | 3 | 2.20459e-05 |
    | 4 | 3.36475e-10 |
    | 5 | 1.41990e-16 |
    |---+-------------|

It looks like the exponents are in roughly a linear progression, so maybe you could fit a line fairly well to the points on a logarithmic scale. In fact, empirical studies suggest that the probability that a permutation of the first n² positive integers is magic decreases a little faster than exponentially.

We could fit a linear regression to the logs of the numbers above to come up with an estimate for the result for n = 6. We expect the estimate could be pretty good, and likely an upper bound on the correct answer. Let’s see what actually happens with a little R code.

    > x <- c(3,4,5)
    > y <- 8*c(1/factorial(9), 880/factorial(16), 275305224/factorial(25))
    > m <- lm(log(y) ~ x)
    > predict(m, data.frame(x=c(6)))
    1
    -48.77694

This says we’d estimate that the natural log of the probability that a permutation of the first 6² positive integers is magic is -48.77694. So the estimate of the probability itself is

exp(-48.77694) = 6.55306 × 10⁻²²

We don’t know the number of magic squares of size n = 6, but the number of distinct squares has been estimated [1] at

(0.17745 ± 0.00016) × 1020

and so the total number including rotations and reflections would be 8 times higher. This says we’d expect our probability to be around

8 × 0.17745 × 1020 / 36! = 3.18162 × 10⁻²²

So our estimate is off by about a factor of 2, and as predicted it does give an upper bound.

Looking back at our regression model, the slope is -12.88 and the intercept is 28.53. This suggests that an upper bound of the probability of a permutation of size n² being magical is

exp(28.53 – 12.88 n).

In closing I’d like to point out that the estimate for n = 6 that we’re referencing above did not come from simply permuting 36 integers over and over and counting how many of the permutations correspond to magic squares. That would take far too long. It’s quite likely that after the first billion billion tries you would not have seen a magic permutation. To estimate such a small number to four significant figures requires a more sophisticated Monte Carlo procedure.

Related posts

[1] See OEIS sequence A006052
Degree of magic

A square grid of distinct integers is a magic square if all its rows columns and full diagonals have the same sum. Otherwise it is not a magic square.

Now suppose we fill a square grid with samples from a continuous random variable. The probability that the entries are distinct is 1, but the probability that the square is magic is 0.

We could make this more interesting by asking how close to magic the square is, using a continuous measure of degree of magic, rather than simply asking whether the square is magic or not.

If we have an n by n square of real numbers, we could take the set of n row sums, n column sums, and 2 diagonals as data and look at its range or its variance. These statistics would be zero for a magic square and small for a nearly magic square.

If each element of the square is a sample from a standard normal random variable, what is the distribution of these statistics? How much does the distribution on the numbers matter?

The ring of entire functions

Rings made a bad first impression on me. I couldn’t remember the definitions of all the different kinds of rings, much less have an intuition for what was important about each one. As I recall, all the examples of rings in our course were variations on the integers, often artificial variations.

Entire functions

I’m more interested in analysis than algebra, so my curiosity was piqued when I ran across an appendix on entire functions in the back of an algebra book [1]. This appendix opens with the statement

The ring E of entire functions is a most peculiar ring.

It’s interesting that something so natural from the perspective of analysis is considered peculiar from the perspective of algebra.

An entire function is a function of a complex variable that is analytic in the entire complex plane. Entire functions are functions that have a Taylor series with infinite radius of convergence.

Rings

A ring is a set of things with addition and multiplication operations, and these operations interact as you’d expect via distributive rules. You can add, subtract, and multiply, but not divide: addition is invertible but multiplication is not in general. Clearly the sum or product of entire functions is an entire function. But the reciprocal of an entire function is not an entire function because the reciprocal has poles where the original function has zeros.

So why is the ring of analytic functions peculiar to an algebraist? Osborne speaks of “the Jekyll-Hyde nature of E,” meaning that E is easy to work with in some ways but not in others. If Santa were an algebraist, he would say E is both naughty and nice.

Nice properties

On the nice side, E is an integral domain. That is, if f and g are entire functions and fg = 0, then either f = 0 or g = 0.

If we were looking at functions that were merely continuous, it would be possible for f to be zero in some places and g to be zero in the rest, so that the product fg is zero everywhere.

But analytic functions are much less flexible than continuous functions. If an analytic function is zero on a set of points with a limit point, it’s zero everywhere. If every point in the complex plane is either a zero of f or a zero of g, one of these sets of zeros must have a limit point.

Another nice property of E is that it is a Bezóut domain. This means that if f and g are entire functions with no shared zeros, there exist entire functions λ and μ such that

λf + μg = 1.

This is definition is analogous to (and motivated by) Bezóut’s theorem in number theory which says that if a and b are relatively prime integers, then there are integers m and n such that

ma + nb = 1.

Naughty properties

The naughty properties of E take longer to describe and involve dimension. “Nice” rings have small Krull dimension. For example Artinian rings have Krull dimension 0, and the ring of polynomials in n complex variables has dimension n. But the Krull dimension of the ring of entire functions is infinite. In fact it’s “very infinite” in the sense that it is at least

2^{\aleph_1}

and so the Krull dimension of E is larger than the cardinality of the complex numbers.

Wittgenstein’s ruler

Nassim Taleb described Wittgenstein’s ruler this way:

Unless you have confidence in the ruler’s reliability, if you use a ruler to measure a table you may also be using the table to measure the ruler. The less you trust the ruler’s reliability, the more information you are getting about the ruler and the less about the table.

An algebraist would say that entire functions are weird, but an analyst could say that on the contrary, ring theory, or at least Krull dimension, is weird.

Related posts

[1] Basic Homological Algebra by M. Scott Osborne.