Maximum principle and approximating boundary value problems

Solutions to differential equations often satisfy some sort of maximum principle, which can in turn be used to construct upper and lower bounds on solutions.

We illustrate this in one dimension, using a boundary value problem for an ordinary differential equation (ODE).

Maximum principles

If the second derivative of a function is positive over an open interval (ab), the function cannot have a maximum in that interval. If the function has a maximum over the closed interval [ab] then it must occur at one of the ends, at a or b.

This can be generalized, for example, to the following maximum principle. Let L be the differential operator

L[u] = u” + g(x)u’ + h(x)

where g and h are bounded functions on some interval [a, b] and h is non-positive. Suppose L[u] ≥ 0 on (a, b). If u has an interior maximum, then u must be constant.

Boundary value problems

Now suppose that we’re interested in the boundary value problem L[u] = f where we specify the values of u at the endpoints a and b, i.e. u(a) = ua and u(b) = ub. We can construct an upper bound on u as follows.

Suppose we find a function z such that L[z] ≤ f and z(a) ≥ ua and z(b) ≥ ub. Then by applying the maximum principle to uz, we see that uz must be ≤ 0, and so z is an upper bound for u.

Similarly, suppose we find a function w such that L[w] ≥ f and w(a) ≤ ua and w(b) ≤ ub. Then by applying the maximum principle to wu, we see that w v u must be ≤ 0, and so w is an lower bound for u.

Note that any functions z and w that satisfy the above requirements give upper and lower bounds, though the bounds may not be very useful. By being clever in our choice of z and w we may be able to get tighter bounds. We might start by choosing polynomials, exponentials, etc. Any functions that are easy to work with and see how good the resulting bounds are.

Tomorrow’s post is similar to this one but looks at bounds for an initial value problem rather than a boundary value problem.

Airy equation example

The following is an elaboration on an example from [1]. Suppose we want to bound solutions to

u”(x) − x u(x) = 0

where u(0) = 0 and u(1) = 1. (This is a well-known equation, but for purposes of illustration we’ll pretend at first that we know nothing about its solutions.)

For our upper bound, we can simply use z(x) = x. We have L[z] ≤ 0 and z satisfies the boundary conditions exactly.

For our lower bound, we use w(x) = x − βx(1 − x). Why? The function z already satisfies the boundary condition. If we add some multiple of x(1 − x) we’ll maintain the boundary condition since x(1 − x) is zero at 0 and 1. The coefficient β gives us some room to maneuver. Turns out L[w] ≥ 0 if β ≥ 1/2. If we choose β = 1/2 we have

(xx2)/2 ≤ u(x) ≤ x

In general, you don’t know the function you’re trying to bound. That’s when bounds are most useful. But this is a sort of toy example because we do know the solution. The equation in this example is well known and is called Airy’s equation. The Airy functions Ai and Bi are independent solutions. Here’s a plot of the solution with its upper and lower bounds.
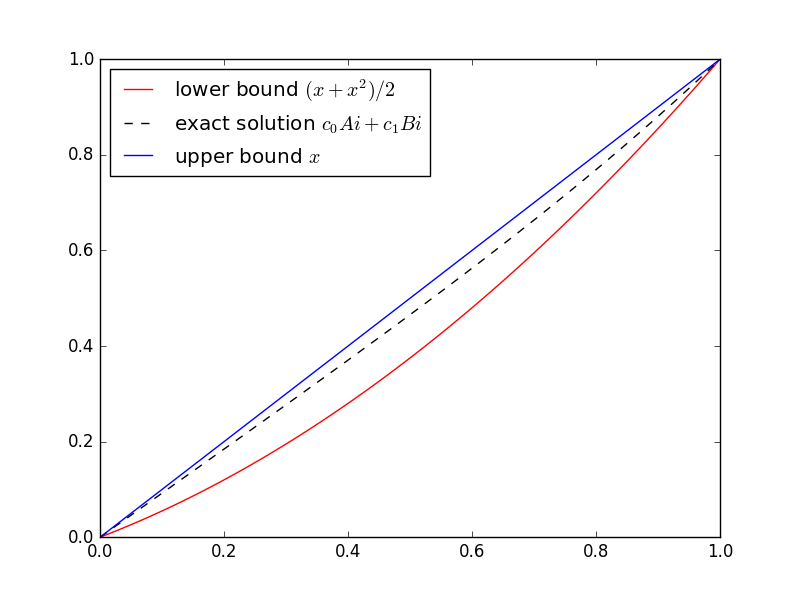
Here’s the Python code I used to solve for the coefficients of Ai and Bi and make the plot.

import numpy as np
from scipy.linalg import solve
from scipy.special import airy
import matplotlib.pyplot as plt

# airy(x) returns (Ai(x), Ai'(x), Bi(x), Bi'(x))
def Ai(x):
    return airy(x)[0]

def Bi(x):
    return airy(x)[2]

M = np.matrix([[Ai(0), Bi(0)], [Ai(1), Bi(1)]])
c = solve(M, [0, 1])

t = np.linspace(0, 1, 100)
plt.plot(t, (t + t**2)/2, 'r-', t, c[0]*Ai(t) + c[1]*Bi(t), 'k--', t, t, 'b-',)
plt.legend(["lower bound $(x + x^2)/2$", 
    "exact solution $c_0Ai + c_1Bi$", 
    "upper bound $x$"], loc="upper left")
plt.show()

SciPy’s function airy has an optimization that we waste here. The function computes Ai and Bi and their first derivatives all at the same time. We could take advantage of that to remove some redundant computations, but that would make the code harder to read. We chose instead to wait an extra nanosecond for the plot.

Help with differential equations

* * *

[1] Murray Protter and Hans Weinberger. Maximum Principles in Differential Equations.

Dilogarithm, polylogarithm, and related functions

The functions dilogarithm, trilogarithm, and more generally polylogarithm are meant to be generalizations of the logarithm. I first came across the dilogarithm in college when I was evaluating some integral with Mathematica, and they’ve paid a visit occasionally ever since.

Unfortunately polylogarithms are defined in several slightly different and incompatible ways. I’ll start by following An Atlas of Functions and then mention differences in A&S, SciPy, and Mathematica.

Polylogarithms

According to Atlas,

Polylogarithms are themselves special cases of Lerch’s function. Also known as Jonquière’s functions (Ernest Jean Philippe Fauque de Jonquières, 1820–1901, French naval officer and mathematician), they appear in the Feynman diagrams of particle physics.

The idea is to introduce an extra parameter ν in the power series for natural log:

\mbox{polyln}_\nu(x) = -\sum_{j=1}^\infty \frac{(1-x)^j}{j^\nu}

When ν = 1 we get the ordinary logarithm, i.e. polyln1 = log. Then polyln2 is the dilogarithm diln, and polyln3 is the trilogarithm triln.

One advantage of the definition in Atlas is that the logarithm is a special case of the polylogarithm. Other conventions don’t have this property.

Other conventions

The venerable A&S defines dilogarithms in a way that’s equivalent to the negative of the definition above and does not define polylogarithms of any other order. SciPy’s special function library follows A&S. SciPy uses the name spence for the dilogarithm for reasons we’ll get to shortly.

Mathematica has the function PolyLog[ν, x] that evaluates to

\mbox{Li}_\nu(x) = \sum_{j=1}^\infty \frac{x^j}{j^\nu}

So polylnν above corresponds to -PolyLog[ν, -x] in Mathematica. Matlab’s polylog is the same as Mathematica’s PolyLog.

Relation to other functions

Spence’s integral is the function of x given by the integral

\int_1^x \frac{\log t}{t-1}\, dt

and equals diln(x). Note that the SciPy function spence returns the negative of the integral above.

The Lerch function mentioned above is named for Mathias Lerch (1860–1922) and is defined by the integral

\Phi(x, \nu, u) = \frac{1}{\Gamma(\nu)} \int_0^\infty \frac{t^{\nu-1} \exp(-ut)}{1 - x\exp(-t)} \, dt

The connection with polylogarithms is easier to see from the series expansion:

\Phi(x, \nu, u) = \sum_{j=0}^\infty \frac{x^j}{(j+u)^\nu}

The connection with polylogarithms is then

\Phi(x, \nu,1) = -\frac{1}{x} \mbox{polyln}_\nu(1-x)

Note that the Lerch function also generalizes the Hurwitz zeta function, which in turn generalizes the Riemann zeta function. When x = 1, the Lerch function reduces to ζ(ν, u).

Related: Applied complex analysis

General birthday problem

The birthday problem, sometimes called the birthday paradox, says that it’s more likely than you’d expect that two people in a group have the same birthday. Specifically, in a random sample of 23 people, there’s about a 50-50 chance that two people share the same birthday.

The birthday problem makes a nice party trick, but generalizations of the problem come up frequently in applications. I wrote in the previous post how it comes up in seeding distributed Monte Carlo simulations. In computer science, it’s a concern in hashing algorithms.

If you have a set of N things to choose from, such as N = 365 birthdays, and take r samples, the probability that all r samples are unique is

p = \frac{N!}{N^r (N-r)!}

and the probability that at least two of the samples are the same is 1 − p. (This assumes that N is at least as big as r. Otherwise the denominator is undefined, but in that case we know p is 0.)

With moderately large values of N and r the formula is likely to overflow if implemented directly. So as usual the trick is to use logarithms to avoid overflow or underflow. Here’s how you could compute the probability above in Python. SciPy doesn’t have a log factorial function, but does have a log gamma function, so we use that instead.

    from scipy import exp, log
    from scipy.special import gammaln

    def prob_unique(N, r):
        return exp( gammaln(N+1) - gammaln(N-r+1) - r*log(N) )


Related: Need help with randomization?

Spectral coordinates in Python

A graph doesn’t have any geometric structure unless we add it. The vertices don’t come with any position in space. The same graph can look very different when arranged different ways.

Spectral coordinates are a natural way to draw a graph because they are determined by the properties of the graph, not arbitrary aesthetic choices. Construct the Laplacian matrix and let x and y be the eigenvectors associated with the second and third eigenvalues. (The smallest eigenvalue is always zero and has an eigenvector of all 1’s. The second and third eigenvalues and eigenvectors are the first to contain information about a graph.) The spectral coordinates of the ith node are the ith components of x and y.

We illustrate this with a graph constructed from a dodecahedron, a regular solid with twenty vertices and twelve pentagonal faces. You can make a dodecahedron from a soccer ball by connecting the centers of all the white hexagons. Here’s one I made from Zometool pieces for a previous post:

Although we’re thinking of this graph as sitting in three dimensions, the nodes being the corners of pentagons etc., the graph simply says which vertices are connected to each other. But from this information, we can construct the graph Laplacian and use it to assign plane coordinates to each point. And fortunately, this produces a nice picture:

Here’s how that image was created using Python’s NetworkX library.

    import networkx as nx
    import matplotlib.pyplot as plt
    from scipy.linalg import eigh

    # Read in graph and compute the Laplacian L ...
    
    # Laplacian matrices are real and symmetric, so we can use eigh, 
    # the variation on eig specialized for Hermetian matrices.
    w, v = eigh(L) # w = eigenvalues, v = eigenvectors

    x = v[:,1] 
    y = v[:,2]
    spectral_coordinates = {i : (x[i], y[i]) for i in range(n)}
    G = nx.Graph()
    G.add_edges_from(graph)

    nx.draw(G, pos=spectral_coordinates)
    plt.show()

Update: After posting this I discovered that NetworkX has a method draw_spectral that will compute the spectral coordinates for you.

More spectral graph theory

Estimating the exponent of discrete power law data

Suppose you have data from a discrete power law with exponent α. That is, the probability of an outcome n is proportional to n−α. How can you recover α?

A naive approach would be to gloss over the fact that you have discrete data and use the MLE (maximum likelihood estimator) for continuous data. That does a very poor job [1]. The discrete case needs its own estimator.

To illustrate this, we start by generating 5,000 samples from a discrete power law with exponent 3 in the following Python code.

   import numpy.random

   alpha = 3
   n = 5000
   x = numpy.random.zipf(alpha, n)

The continuous MLE is very simple to implement:

    alpha_hat = 1 + n / sum(log(x))

Unfortunately, it gives an estimate of 6.87 for alpha, though we know it should be around 3.

The MLE for the discrete power law distribution satisfies

\frac{\zeta'(\hat{\alpha})}{\zeta(\hat{\alpha})} = -\frac{1}{n} \sum_{i-1}^n \log x_i

Here ζ is the Riemann zeta function, and xi are the samples. Note that the left side of the equation is the derivative of log ζ, or what is sometimes called the logarithmic derivative.

There are three minor obstacles to finding the estimator using Python. First, SciPy doesn’t implement the Riemann zeta function ζ(x) per se. It implements a generalization, the Hurwitz zeta function, ζ(x, q). Here we just need to set q to 1 to get the Riemann zeta function.

Second, SciPy doesn’t implement the derivative of zeta. We don’t need much accuracy, so it’s easy enough to implement our own. See an earlier post for an explanation of the implementation below.

Finally, we don’t have an explicit equation for our estimator. But we can easily solve for it using the bisection algorithm. (Bisect is slow but reliable. We’re not in a hurry, so we might as use something reliable.)

    from scipy import log
    from scipy.special import zeta
    from scipy.optimize import bisect 

    xmin = 1

    def log_zeta(x):
        return log(zeta(x, 1))

    def log_deriv_zeta(x):
        h = 1e-5
        return (log_zeta(x+h) - log_zeta(x-h))/(2*h)

    t = -sum( log(x/xmin) )/n
    def objective(x):
        return log_deriv_zeta(x) - t

    a, b = 1.01, 10
    alpha_hat = bisect(objective, a, b, xtol=1e-6)
    print(alpha_hat)

We have assumed that our data follow a power law immediately from n = 1. In practice, power laws generally fit better after the first few elements. The code above works for the more general case if you set xmin to be the point at which power law behavior kicks in.

The bisection method above searches for a value of the power law exponent between 1.01 and 10, which is somewhat arbitrary. However, power law exponents are very often between 2 and 3 and seldom too far outside that range.

The code gives an estimate of α equal to 2.969, very near the true value of 3, and much better than the naive estimate of 6.87.

Of course in real applications you don’t know the correct result before you begin, so you use something like a confidence interval to give you an idea how much uncertainty remains in your estimate.

The following equation [2] gives a value of σ from a normal approximation to the distribution of our estimator.

\sigma = \frac{1}{\sqrt{n\left[ \frac{\zeta''(\hat{\alpha}, x_{min})}{\zeta(\hat{\alpha}, x_{min})} - \left(\frac{\zeta'(\hat{\alpha}, x_{min})}{\zeta(\hat{\alpha}, x_{min})}\right)^2\right]}}

So an approximate 95% confidence interval would be the point estimate +/− 2σ.

    from scipy.special import zeta
    from scipy import sqrt

    def zeta_prime(x, xmin=1):
        h = 1e-5
        return (zeta(x+h, xmin) - zeta(x-h, xmin))/(2*h)

    def zeta_double_prime(x, xmin=1):
        h = 1e-5
        return (zeta(x+h, xmin) -2*zeta(x,xmin) + zeta(x-h, xmin))/h**2

    def sigma(n, alpha_hat, xmin=1):
        z = zeta(alpha_hat, xmin)
        temp = zeta_double_prime(alpha_hat, xmin)/z
        temp -= (zeta_prime(alpha_hat, xmin)/z)**2
        return 1/sqrt(n*temp)

    print( sigma(n, alpha_hat) )

Here we use a finite difference approximation for the second derivative of zeta, an extension of the idea used above for the first derivative. We don’t need high accuracy approximations of the derivatives since statistical error will be larger than the approximation error.

In the example above, we have α = 2.969 and σ = 0.0334, so a 95% confidence interval would be [2.902, 3.036].

***

[1] Using the continuous MLE with discrete data is not so bad when the minimum output xmin is moderately large. But here, where xmin = 1 it’s terrible.

[2] Equation 3.6 from Power-law distributions in empirical data by Aaron Clauset, Cosma Rohilla Shalizi, and M. E. J. Newman.


Numerical differentiation

Today I needed to the derivative of the zeta function. SciPy implements the zeta function, but not its derivative, so I needed to write my own version.

The most obvious way to approximate a derivative would be to simply stick a small step size into the definition of derivative:

f’(x) ≈ (f(x + h) − f(x)) / h

However, we could do much better using

f’(x) ≈ (f(x + h) − f(x − h)) / 2h

To see why, expand f(x) in a power series:

f(x + h) = f(x) + h f‘(x) + h2 f”(x)/2 + O(h3)

A little rearrangement shows that the error in the one-sided difference, the first approximation above, is O(h). Now if you replace h with –h and do a little algebra you can also show that the two-sided difference is O(h2). When h is small, h2 is very small, so the two-sided version will be more accurate for sufficiently small h.

So how small should h be? The smaller the better, in theory. In computer arithmetic, you lose precision whenever you subtract two nearly equal numbers. The more bits two numbers share, the more bits of precision you may lose in the subtraction. In my application, h = 10−5 works well: the precision after the subtraction in the numerator is comparable to the precision of the (two-sided) finite difference approximation. The following code was adequate for my purposes.

    from scipy.special import zeta

    def zeta_prime(x):
        h = 1e-5
        return (zeta(x+h,1) - zeta(x-h,1))/(2*h)

The zeta function in SciPy is Hurwitz zeta function, a generalization of the Riemann zeta function. Setting the second argument to 1 gives the Riemann zeta function.

There’s a variation on the method above that works for real-valued functions that extend to a complex analytic function. In that case you can use the complex step differentiation trick to use

Im( f(x + ih)/h )

to approximate the derivative. It amounts to the two-sided finite difference above, except you don’t need to have a computer carry out the subtraction, and so you save some precision. Why’s that? When x is real, xih and xih are complex conjugates, and f(x − ih) is the conjugate of f(x + ih), i.e. conjugation and function application commute in this setting. So (f(x + ih) − f(x − ih)) is twice the imaginary part of f(x + ih).

SciPy implements complex versions many special functions, but unfortunately not the zeta function.

Effective Computation in Physics

Earlier this week I had a chance to talk with Anthony Scopatz and Katy Huff about their new book, Effective Computation in Physics.

***

JC: Thanks for giving me a copy of the book when we were at SciPy 2015. It’s a nice book. It’s about a lot more than computational physics.

KH: Right. If you think of it as physical science in general, that’s the group we’re trying to target.

JC: Targeting physical science more than life science?

KH: Yes. You can see that more in the data structures we cover which are very float-based rather than things like strings and locations.

AS: To second that, I’d say that all the examples are coming from the physical sciences. The deep examples, like in the parallelism chapter, are most relevant to physicists.

JC: Even in life sciences, there’s a lot more than sequences of base pairs.

KH: Right. A lot of people have asked what chapters they should skip. It’s probable that ecologists or social scientists are not going to be interested in the chapter about HDF5. But the rest of the book, more or less, could be useful to them.

JC: I was impressed that there’s a lot of scattered stuff that you need to know that you’ve brought into one place. This would be a great book to hand a beginning grad student.

KH: That was a big motivation for writing the book. Anthony’s a professor now and I’m applying to be a professor and I can’t spend all my time ramping students up to be useful researchers. I’d rather say “Here’s a book. It’s yours. Come to me if it’s not in the index.”

JC: And they’d rather have a book that they could access any time than have to come to you.  Are you thinking of doing a second edition as things change over time?

AS: It’s on the table to do a second edition eventually. Katy and I will have the opportunity if the book is profitable and the material becomes out of date. O’Reilly could ask someone else to write a second edition, but they would ask us first.

JC: Presumably putting out a second edition would not be as much work as creating the first one.

KH: I sure hope not!

AS: There’s a lot of stuff that’s not in this book. Greg Wilson jokingly asked us when Volume 2 would come out. There may be a need for a more intermediate book that extends the topics.

KH: And maybe targets languages other than Python where you’re going to have to deal with configuring and building, installing and linking libraries, that kind of stuff. I’d like to cover more of that, but Python doesn’t have that problem!

JC: You may sell a lot of books when the school year starts.

KH: Anthony and I both have plans for courses based around this book. Hopefully students will find it helpful.

JC: Maybe someone else is planning the same thing. It would be nice if they told you.

AS: A couple people have approached us about doing exactly that. Something I’d like to see is for people teaching courses around it to pull their curriculum together.

JC: Is there a website for the book, other than an errata page at the publisher?

KH: Sure, there’s physics.codes. Anthony put that up.

AS: There’s also a GitHub repo, physics-codes. That’s where you can find code for all the examples, and that should be kept up to date. We also have a YouTube channel.

JC: When did y’all start writing the book?

AS: It was April or May last year when we finally started writing. There was a proposal cycle six or seven months before that. Katy and I were simultaneously talking to O’Reilly, so that worked out well.

KH: In a sense, the book process started for me in graduate school with The Hacker Within and Software Carpentry. A lot of the flows in the book come from the outlines of Hacker Within tutorials and Software Carpentry tutorials years ago.

AS: On that note, what happened for me, I took those tutorials and turned them into a masters course for AIMS, African Institute for Mathematical Sciences. At the end I thought it would be nice if this were a book. It didn’t occur to me that there was a book’s worth of material until the end of the course at AIMS. I owe a great debt to AIMS in that way.

JC: Is there something else you’d like to say about the book that we haven’t talked about?

KH: I think it would be a fun exercise for someone to try to determine which half of the chapters I wrote and which Anthony wrote. Maybe using some sort of clustering algorithm or pun detection. If anyone wants to do that sort of analysis, I’d love to see if you guess right. Open competition. Free beer from Katy if you can figure out which half. We split the work in half, but it’s really mixed around.  People who know us well will probably know that Anthony’s chapters have a high density of puns.

AS: I think the main point that I would like to see come across is that the book is useful to a broader audience outside the physical sciences. Even for people who are not scientists themselves, it’s useful to describe the mindset of physical scientists to software developers or managers. That communication protocol kinda goes both ways, though I didn’t expect that when we started out.

JC: I appreciate that it’s one book. Obviously it won’t cover everything you need to know. But it’s not like here’s a book on Linux, here’s a book on git, here are several books on Python. And some of the material in here isn’t in any book.

KH: Like licensing. Anthony had the idea to add the chapter on licensing. We get asked all the time “Which license do you use? And why?” It’s confusing, and you can get it really wrong.

* * *

Check out Effective Computation in Physics. It’s about more than physics. It’s a lot of what you need to know to get started with scientific computing in Python, all in one place.

Related:

Scientific computing in Python

Scientific computing in Python is expanding and maturing rapidly. Last week at the SciPy 2015 conference there were about twice as many people as when I’d last gone to the conference in 2013.

You can get some idea of the rapid develop of the scientific Python stack and its future direction by watching the final keynote of the conference by Jake VanderPlas.

I used Python for a while before I discovered that there were so many Python libraries for scientific computing. At the time I was considering learning Ruby or some other scripting language, but I committed to Python when I found out that Python has far more libraries for the kind of work I do than other languages do. It felt like I’d discovered a secret hoard of code. I expect it would be easier today to discover the scientific Python stack. (It really is becoming more of an integrated stack, not just a collection of isolated libraries. This is one of the themes in the keynote above.)

When people ask me why I use Python, rather than languages like Matlab or R, my response is that I do a mixture of mathematical programming and general programming. I’d rather do mathematics in a general programming language than do general programming in a mathematical language.

One of the drawbacks of Python, relative to C++ and related languages, is speed. This is a problem in languages like R as well. However, with Python there are ways to speed up code without completely rewriting it, such as Cython and Numba. The only reliable way I’ve found to make R much faster, is to rewrite it in another language.

Another drawback of Python until recently was that data manipulation and exploration were not as convenient as one would hope. However, that has changed due to developments such as Pandas, initiated by Wes McKinney. For more on how that came to be and where it’s going, see his keynote from the second day of SciPy 2015.

It’s not clear why Python has become the language of choice for so many people in scientific computing. Maybe if people like Travis Oliphant had decided to use some other language for scientific programming years ado, we’d all be using that language now. Python wasn’t intended to be a scientific programming language. And as Jake VanderPlas points out in his keynote, Python still is not a scientific programming language, but the foundation for a scientific programming stack. Maybe Python’s strength is that it’s not a scientific language. It has drawn more computer scientists to contribute to the core language than it would have if it had been more of a domain-specific language.

* * *

If you’d like help moving to the Python stack, please let me know.

Random walks and the arcsine law

Suppose you stand at 0 and flip a fair coin. If the coin comes up heads, you take a step to the right. Otherwise you take a step to the left. How much of the time will you spend to the right of where you started?

As the number of steps N goes to infinity, the probability that the proportion of your time in positive territory is less than x approaches 2 arcsin(√x)/π. The arcsine term gives this rule its name, the arcsine law.

Here’s a little Python script to illustrate the arcsine law.

import random
from numpy import arcsin, pi, sqrt

def step():
    u = random.random()
    return 1 if u < 0.5 else -1

M = 1000 # outer loop
N = 1000 # inner loop

x = 0.3 # Use any 0 < x < 1 you'd like. 
outer_count = 0 
for _ in range(M): 
    n = 0 
    position= 0 
    inner_count = 0 
    for __ in range(N): 
        position += step() 
    if position > 0:
        inner_count += 1
    if inner_count/N < x:
        outer_count += 1

print (outer_count/M)
print (2*arcsin(sqrt(x))/pi)