Exactly one month ago I wrote about sampling points from a triangle. This post will look at the three dimensional analog, sampling from a tetrahedron. The generalization to higher dimensions works as well.
Sampling from a triangle
In the triangle post, I showed that a naive approach doesn’t work but a variation does. If the vertices of the triangle are A, B, and C, then the naive approach is to generate three uniform random numbers, normalize them, and use them to form a linear combination of the vertices. That is, generate
r1, r2, r3
uniformly from [0, 1], then define
r1′ = r1/(r1 + r2 + r3)
r2′ = r2/(r1 + r2 + r3)
r3′ = r3/(r1 + r2 + r3)
and return as a random sample the point
r1′ A + r2′ B + r3′ C.
This oversamples points near the middle of the triangle and undersamples points near the vertices. But everything above works if you replace uniform samples with exponential samples.
Sampling from a tetrahedron
The analogous method works for a tetrahedron with vertices A, B, C, and D. Generate exponential random variables ri for i = 1, 2, 3, 4. Then normalize, defining each ri′ to be ri divided by the sum of all the ri s. Then the random sample is
r1′ A + r2′ B + r3′ C + r4′ D.
In the case of the triangle, it was easy to visualize that uniformly generated rs did not lead to uniform samples of the triangle, but that exponentially generated rs did. This is harder to do in three dimensions. Even if the points were uniformly sampled from a tetrahedron, they might not look uniformly distributed from a given perspective.
So how might we demonstrate that our method works? One approach would be to take a cube inside a tetrahedron and show that the proportion of samples that land inside the cube is what we’d expect, namely the ratio of the volume of the cube to the volume of the tetrahedron.
This brings up a couple interesting subproblems.
- How do we compute the volume of a tetrahedron?
- How can we test whether our cube lies entirely within the tetrahedron?
Volume of a tetrahedron
To find the volume of a tetrahedron, form a matrix M whose columns are the vectors from three of the vertices to the remaining vertex. So we could take A − D, B − D, and C − D. The volume of the tetrahedron is the determinant of M divided by 6.
Testing whether a cube is inside a tetrahedron
A tetrahedron is convex, and so the line segment joining any two points inside the tetrahedron lies entirely inside the tetrahedron. It follows that if all the vertices of a cube are inside the a tetrahedron, the entire cube is inside.
So this brings us to the problem of testing whether a point is inside a tetrahedron. We can do this by converting the coordinates of the point to barycentric coordinates, then testing whether all the coordinates are non-negative and add to 1.
Random sampling illustration
I made up four points as vertices of a tetrahedron.
import numpy as np

A = [0, 0, 0]
B = [5, 0, 0]
C = [0, 7, 0]
D = [0, 1, 6]
A, B, C, D = map(np.array, [A, B, C, D])
For my test cube I chose the cube whose vertex coordinates are all combinations of 1 and 2. So the vertex nearest the origin is (1, 1, 1) and the vertex furthest from the origin is (2, 2, 2). You can verify that all the vertices are inside the tetrahedron, and so the cube is inside the tetrahedron.
The tetrahedron has volume 35, and the cube has volume 1, so we expect 1/35th of the random points to land inside the cube. Here’s the code to sample the tetrahedron and calculate the proportion of points that land in the cube.
from scipy.stats import expon

def incube(v):
    return 1 <= v[0] <= 2 and 1 <= v[1] <= 2 and 1 <= v[2] <= 2

def good_sample(A, B, C, D):
    r = expon.rvs(size=4)
    r /= sum(r)
    return r[0]*A + r[1]*B + r[2]*C + r[3]*D

def bad_sample(A, B, C, D):
    r = np.random.random(size=4)
    r /= sum(r)
    return r[0]*A + r[1]*B + r[2]*C + r[3]*D

N = 1_000_000

badcount  = 0
goodcount = 0

for _ in range(N):
    v = bad_sample(A, B, C, D)
    if incube(v):
        badcount += 1
    v = good_sample(A, B, C, D)
    if incube(v):
        goodcount += 1

print(badcount/N, goodcount/N, 1/35)
This produced
0.094388 0.028372 0.028571…
The good (exponential) method match the expected proportion to three decimal places but the bad (uniform) method put about 3.3 times as many points in the cube as expected.
Note that three decimal agreement is about what we’d expect via the central limit theorem since 1/√N = 0.001.
If you’re porting the sampler above to an environment where you don’t a function for generating exponential random samples, you can roll your own by returning −log(u) where u is a uniform sample from [0. 1].
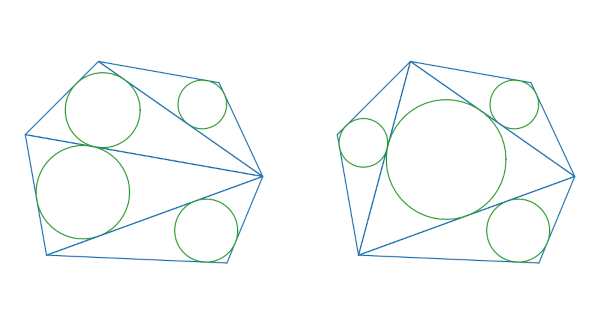
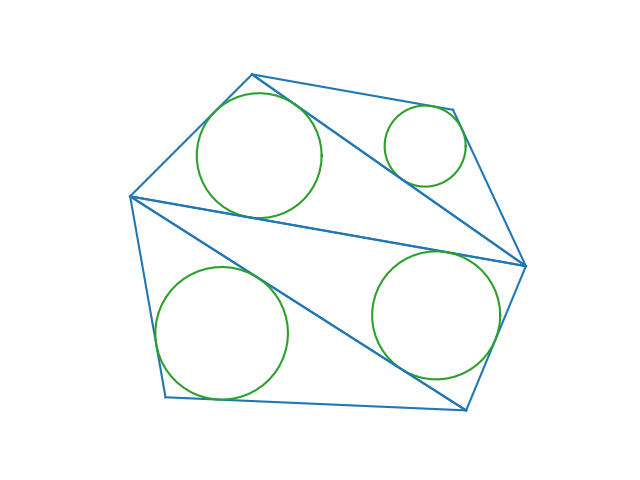
More general 3D regions
After writing the post about sampling from triangles, I wrote a followup post about sampling from polygons. In a nutshell, divide your polygon into triangles, then randomly select a triangle in proportion to its area, then sample with that triangle. You can do the analogous process in three dimensions by dividing a general volume into tetrahedra.