FM signal approximation

FM radio transmits a signal by perturbing (modulating) the frequency of a carrier wave. If the carrier has frequency ω and the signal has frequency q, then the FM signal is

cos(ωt + β cos(qt)).

To understand the modulated signal, it’s useful to write it as a sum of simple sines and cosines with no modulation. I wrote about how to do this exactly using Bessel functions. Today I’ll write about an approximation that’s easier to understand and work with, assuming the modulation index β is small.

Here’s the approximation:

cos(ωt + β cos(qt)) ≈ cos ωt + ½ β ( sin (ω + q)t + sin (ω – q)t ).

This says that to a good approximation, the modulation term adds two sine waves to the carrier, one that adds the signal frequency to the carrier frequency and one that subtracts it.

To establish the approximation and see how the error depends on β, subtract the right side from the left and expand as a Taylor series in β. The first non-zero term in the series is

-½ cos(qt)² cos(ωt) β²

and so if β is small, the approximation error is very small. For example, if β = 0.1, then the approximation error is on the order of 0.005.

As an example, let ω = 10, q = 2, and β = 0.1. Then

cos(10t + 0.1 cos 2t) ≈ cos 10t + 0.05 ( sin 12t + sin 8t )

and the approximation error is plotted below.

As predicted, the amplitude of the error is around 0.005, while the amplitude of the FM signal is 1.

Related posts

Identifying someone from their heart beat

electrocardiogram of a toddler

How feasible would it be to identify someone based from electrocardiogram (EKG, ECG) data? (Apparently the abbreviation “EKG” is more common in America and “ECG” is more common in the UK.)

Electrocardiograms are unique, but unique doesn’t necessarily mean identifiable. Unique data isn’t identifiable without some way to map it to identities. If you shuffle a deck of cards, you will probably produce an arrangement that has never occurred before. But without some sort of registry mapping card deck orders to their shufflers, there’s no chance of identification. (For identification, you’re better off dusting the cards for fingerprints, because there are registries of fingerprints.)

According to one survey [1], researchers have tried a wide variety of methods for identifying people from electrocardiograms. They’ve used time-domain features such as peak amplitudes, slopes, variances, etc., as well as a variety of frequency-domain (DFT) features. It seems that all these methods work moderately well, but none are great, and there’s no consensus regarding which approach is best.

If you have two EKGs on someone, how readily can you tell that they belong to the same person? The answer depends on the size of the set of EKGs you’re comparing it to. The studies surveyed in [1] do some sort of similarity search, comparing a single EKG to tens of candidates. The methods surveyed had an overall success rate of around 95%. But these studies were based on small populations; at least at the time of publication no one had looked at matching an single EKG against thousands of possible matches.

In short, an electrocardiogram can identify someone with high probability once you know that they belong to a relatively small set of people for which you have electrocardiograms.

More identification posts

[1] Antonio Fratini et al. Individual identification via electrocardiogram analysis. Biomed Eng Online. 2015; 14: 78. doi 10.1186/s12938-015-0072-y

Adding phase-shifted sine waves

Suppose you have two sinusoidal functions with the same frequency ω but with different phases and different amplitudes:

f(t) = A sin(ωt)

and

g(t) = B sin(ωt + φ).

Then their sum is another sine wave with the same frequency

h(t) = C sin(ωt + ψ).

Note that this includes cosines as a special case since a cosine is a sine with phase shift φ = 90°.

Sum of two phase-shifted sine waves with the same frequency is another sine wave

This post will

  • prove that the sum of sine waves is another sine wave,
  • show how to find its amplitude and phase, and
  • discuss the significance of this result in signal processing.

Finding the amplitude and phase

Note f + g and h both satisfy the second order differential equation

y” = – ω² y

Therefore if they also satisfy the same initial conditions y(0) and y‘(0) then they’re the same function.

The functions  f + g and h are equal at 0 if

B sin(φ) = C sin(ψ).

and their derivatives are equal at 0 if

ω A + ω B cos(φ) = ω C cos(ψ).

Taking ratios says that

tan(ψ) = B sin(φ) / (AB cos(φ))

or

ψ = arctan( B sin(φ) / (AB cos(φ)) ).

Once we have ψ, we solve for C and find

C = B sin(φ) / sin(ψ).

Special case of sine and cosine

Let’s look at the special case of φ = 90°, i.e. adding A sin(ωt) and B cos(ωt). Then sin(φ) = 1 and cos(φ) = 0, and the equation for ψ simplifies to

ψ = arctan(B/A).

If an angle has tangent B/A, then it’s sine is B / √(A² + B²), and so we have

C = √(A² + B²).

Linear time invariant (LTI) systems

A linear, time-invariant system can differentiate or integrate signals. It can change their amplitude or phase. And it can add two signals together.

It’s easy to see that changing the amplitude or phase of a signal doesn’t change its frequency. It’s also easy to see that differentiation and integration of sine waves doesn’t change their frequency. But it’s not as clear that adding two sines with the same frequency doesn’t change their frequency. Here we’ve shown that’s the case.

Bode plots are a way to show how an LTI system changes in response to changes in its inputs. These plots show what happens to the amplitude and to the phase. They don’t need to show what happens to the frequency because the frequency doesn’t change.

More signal processing posts

Clipped sine waves

One source of distortion in electronic music is clipping. The highest and lowest portions of a wave form are truncated due to limitations of equipment. As the gain is increased, the sound doesn’t simply get louder but also becomes more distorted as more of the signal is clipped off.

Clipping 0.2

For example, here is what a sine wave looks like when clipped 20%, i.e. cut off to be between -0.8 and 0.8.

Sine clipped at 0.8

A simple sine wave has only one Fourier component, itself. But when we clip the sine wave, we move energy into higher frequency components. We can see that in the Fourier components below.

Fourier coefficients of sine clipped at 0.8

You can show by symmetry that the even-numbered coefficients are exactly zero.

Clipping 0.6

Here are the corresponding plots for 60% clipping, i.e. the absolute value of the signal is cut off to be 0.4. First the signal

Sine clipped at 0.8

and then its Fourier components.

Fourier coefficients of sine clipped at 0.8

Here are the first five sine waves with the amplitudes given by the Fourier coefficients.

Fourier components

And here we see how the of the sines above do a pretty good job of reconstructing the original clipped sine. We’d need an infinite number of Fourier components to exactly reconstruct the original signal, but the first five components do most of the work.

Adding up the first five Fourier components

Continuous range of clipping

Next let’s look at the ratio of the energy in the 3rd component to that of the 1st component as we continuously vary the amount of clipping.

Ratio of energy in 3rd harmonic to fundamental

Now for the 5th harmonic. This one is interesting because it’s not strictly increasing but rather has a little bump before it starts increasing.

Ratio of energy in 5th harmonic to fundamental

Finally, here’s the ratio of the energy in all higher frequencies to the energy in the fundamental.

Ratio of energy in all higher frequences combined to fundamental

More Fourier series posts

Area of sinc and jinc function lobes

Someone left a comment this morning on my blog post on sinc and jinc integrals regarding the area of the lobes.

It would be nice to have the values of integrals of each lobe, i.e. integrals between 0 and multiples of pi. Anyone knows of such a table?

This post will include Python code to address that question. (Update: added asymptotic approximation. See below.)

First, let me back up and explain the context. The sinc function is defined as [1]

sinc(x) = sin(x) / x

and the jinc function is defined analogously as

jinc(x) = J1(x) / x,

substituting the Bessel function J1 for the sine function. You could think of Bessel functions as analogs of sines and cosines. Bessel functions often come up when vibrations are described in polar coordinates, just as sines and cosines come up when using rectangular coordinates.

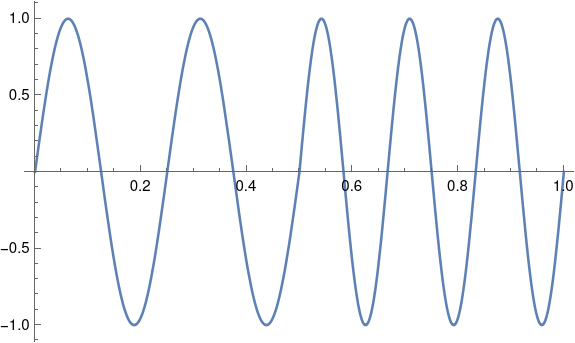
Here’s a plot of the sinc and jinc functions:

The lobes are the regions between crossings of the x-axis. For the sinc function, the lobe in the middle runs from -π to π, and for n > 0 the nth lobe runs from nπ to (n+1)π. The zeros of Bessel functions are not uniformly spaced like the zeros of the sine function, but they come up in application frequently and so it’s easy to find software to compute their locations.

First of all we’ll need some imports.

    from scipy import sin, pi
    from scipy.special import jn, jn_zeros
    from scipy.integrate import quad

The sinc and jinc functions are continuous at zero, but the computer doesn’t know that [2]. To prevent division by zero, we return the limiting value of each function for very small arguments.

    def sinc(x):
        return 1 if abs(x) < 1e-8 else sin(x)/x

    def jinc(x):
        return 0.5 if abs(x) < 1e-8 else jn(1,x)/x

You can show via Taylor series that these functions are exact to the limits of floating point precision for |x| < 10-8.

Here’s code to compute the area of the sinc lobes.

    def sinc_lobe_area(n):
        n = abs(n)
        integral, info = quad(sinc, n*pi, (n+1)*pi)
        return 2*integral if n == 0 else integral

The corresponding code for the jinc function is a little more complicated because we need to compute the zeros for the Bessel function J1. Our solution is a little clunky because we have an upper bound N on the lobe number. Ideally we’d work out an asymptotic value for the lobe area and compute zeros up to the point where the asymptotic approximation became sufficiently accurate, and switch over to the asymptotic formula for sufficiently large n.

    def jinc_lobe_area(n):
        n = abs(n)
        assert(n < N)
        integral, info = quad(jinc, jzeros[n-1], jzeros[n])
        return 2*integral if n == 0 else integral

Note that the 0th element of the array returned by jn_zeros is the first positive zero of J1; it doesn’t include the zero at the origin.

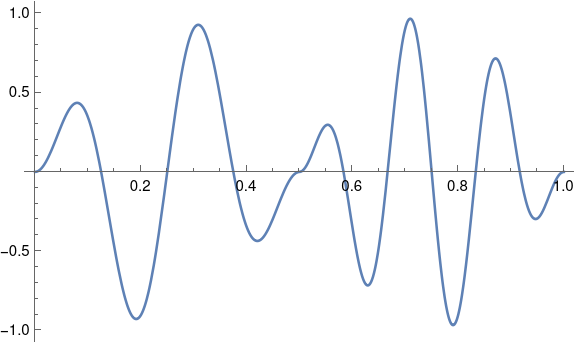
For both sinc and jinc, the even numbered lobes have positive area and the odd numbered lobes have negative area. Here’s a plot of the absolute values of the lobe areas.

Asymptotic results

We can approximate the area of the nth lobe of the sinc function by using a midpoint approximation for 1/x. It works out that the area is asymptotically equal to

 (-1)^n \frac{4}{(2n+1)\pi}

We can do a similar calculation for the area of the nth jinc lobe, starting with the asymptotic approximation for jinc given here. We find that the area of the nth lobe of the jinc function is asymptotically equal to

\frac{(-1)^n}{\pi^2} \left( \frac{8}{4n+3} \right )^{3/2}

To get an idea of the accuracy of the asymptotic approximations, here are the results for n=100.

    sinc area:      0.00633455
    asymptotic:     0.00633452
    absolute error: 2.97e-8
    relative error: 4.69e-6

    jinc area:      0.000283391
    asymptotic:     0.000283385
    absolute error: 5.66e-9
    relative error: 2.00e-5

More signal processing posts

[1] Some authors define sinc(x) as sin(πx)/πx. Both definitions are common.

[2] Scipy has a sinc function in scipy.special, defined as sin(πx)/πx, but it doesn’t have a jinc function.

The Engineer’s Nyquist frequency and the sampling theorem

The Nyquist sampling theorem says that a band-limited signal can be recovered from evenly-spaced samples. If the highest frequency component of the signal is fc then the function needs to be sampled at a frequency of at least the Nyquist frequency 2fc. Or to put it another way, the spacing between samples needs to be no more than Δ = 1/2fc.

If the signal is given by a function h(t), then the Nyquist-Shannon sampling theorem says we can recover h(t) by

h(t) = \sum_{n=-\infty}^\infty h(n\Delta)\, \mathrm{sinc}(2f_c t- n)

where sinc(x) = sin(πx) / πx.

In practice, signals may not entirely band-limited, but beyond some frequency fc higher frequencies can be ignored. This means that the cutoff frequency fc is somewhat fuzzy. As we demonstrate below, it’s much better to err on the side of making the cutoff frequency higher than necessary. Sampling at a little less than the necessary frequency can cause the reconstructed signal to be a poor approximation of the original. That is, the sampling theorem is robust to over-sampling but not to under-sampling. There’s no harm from sampling more frequently than necessary. (No harm as far as the accuracy of the equation above. There may be economic costs, for example, that come from using an unnecessarily high sampling rate.)

Let’s look at the function h(t) = cos(18πt) + cos(20πt). The bandwidth of this function is 10 Hz, and so the sampling theorem requires that we sample our function at 20 Hz. If we sample at 20.4 Hz, 2% higher than necessary, the reconstruction lines up with the original function so well that the plots of the two functions agree to the thickness of the plotting line.

Function and reconstruction sampling at 20.4 Hz

But if we sample at 19.6 Hz, 2% less than necessary, the reconstruction is not at all accurate due to problems with aliasing.

Function and reconstruction sampling at 19.6 Hz

One rule of thumb is to use the Engineer’s Nyquist frequency of 2.5 fc which is 25% more than the exact Nyquist frequency. An engineer’s Nyquist frequency is sorta like a baker’s dozen, a conventional safety margin added to a well-known quantity.

Update: Here’s a plot of the error, the RMS difference between the signal and its reconstruction, as a function of sampling frequency.

RMS error in reconstruction as a function of sampling frequency

By the way, the function in the example demonstrates beats. The sum of a 9 Hz signal and a 10 Hz signal is a 9.5 Hz signal modulated at 0.5 Hz. More details on beats in this post on AM radio and musical instruments.

Paul Klee meets Perry the Platypus

I was playing around with something in Mathematica and one of the images that came out of it surprised me.

filter contour plot

It’s a contour plot for the system function of a low pass filter.

    H[z_] := 0.05634*(1 + 1/z)*(1 - 1.0166/z + 1/z^2) /
            ((1 - 0.683/z)*(1 - 1.4461/z + 0.7957/z^2))
    ContourPlot[ Arg[H[Exp[I (x + I y)]]], 
                 {x, -1, 1}, {y, -1, 1}, 
                 ColorFunction -> "StarryNightColors"]

It looks sorta like a cross between Paul Klee’s painting Senecio

Senecio by Paul Klee, 1922

and Perry the Platypus from Phineas and Ferb.

Perry the Platypus from Phineas and Ferb

Time series analysis vs DSP terminology

Time series analysis and digital signal processing are closely related. Unfortunately, the two fields use different terms to refer to the same things.

Suppose you have a sequence of inputs x[n] and a sequence of outputs y[n] for integers n.

Moving average / FIR

If each output depends on a linear combination of a finite number of previous inputs

y[n] = b0 x[n] + b1 x[n-1] + … + bq x[nq]

then time series analysis would call this a moving average (MA) model of order q, provided b0 = 1. Note that this might not really be an average, i.e. the b‘s are not necessarily positive and don’t necessarily sum to 1.

Digital signal processing would call this a finite impulse response (FIR) filter of order q.

Autoregressive / IIR

If each output depends on a linear combination of a finite number of previous outputs

y[n] = a1 y[n-1] + … + ap y[np]

then time series analysis would call this an autoregressive (AR) model of order p.

Digital signal processing would call this an infinite impulse response (IIR) filter of order p. 

Sometimes you’ll see the opposite sign convention on the a‘s.

ARMA / IIR

If each output depends on a linear combination of a finite number of previous inputs and outputs

y[n] = b0 x[n] + b1 x[n-1] + … + bq x[nq] + a1 y[n-1] + … + ap y[np]

then time series analysis would call this an autoregressive moving average (ARMA) model of order (pq), i.e. p AR terms and q MA terms.

Digital signal processing would call this an infinite impulse response (IIR) filter with q feedforward coefficients and p feedback coefficients. Also, as above, you may see the opposite sign convention on the a‘s.

ARMA notation

Box and Jenkins use a‘s for input and z‘s for output. We’ll stick with x‘s and y’s to make the comparison to DSP easier.

Using the backward shift operator B that takes a sample at n to the sample at n-1, the ARMA system can be written

φ(B) y[n] = θ(B) x[n]

where φ and θ are polynomials

φ(B) = 1 – φ1B – φ2B² – … φpBp

and

θ(B) = 1 – θ1B – θ2B² – … θqBq.

System function notation

In DSP, filters are described by their system function, the z-transform of the impulse response. In this notation (as in Oppenheim and Shafer, for example) we have

H(z) = \frac{\sum_{k=0}^q b_k z^{-k}}{1 - \sum_{k=1}^p a_k z^{-k}}

The φk in Box and Jenkins correspond to the ak in Oppenheim and Schafer. The θk correspond to the (negative) bk.

The system function H(z) corresponds to θ(1/z) / φ(1/z).

Related

DSP and time series consulting


Width of mixture PDFs

Suppose you draw samples from two populations, one of which has a wider probability distribution than the other. How does the width of the distribution of the combined sample vary as you change the proportions of the two populations?

The extremes are easy. If you pick only from one population, then the resulting distribution will be exactly as wide as the distribution of that population. But what about in the middle? If you pick from both populations with equal probability, will the width resulting distribution be approximately the average of the widths of the two populations separately?

To make things more specific, we’ll draw from two populations: Cauchy and normal. With probability η we will sample from a Cauchy distribution with scale γ and with probability (1-η) we will sample from a normal distribution with scale σ. The resulting combined distribution is a mixture, known in spectroscopy as a pseudo-Voigt distribution. In that field, the Cauchy distribution is usually called the Lorentz distribution.

(Why”pseudo”? A Voigt random variable is the sum of a Cauchy and a normal random variable. Its PDF is a convolution of a Cauchy and a normal PDF. A pseudo-Voigt random variable is the mixture of a Cauchy and a normal random variable. Its PDF is a convex combination of the PDFs of a Cauchy and a normal PDF. In fact, the convex combination coefficients are η and (1-η) mentioned above. Convex combinations are easier to work with than convolutions, at least in some contexts, and the pseudo-Voigt distribution is a convenient approximation to the Voigt distribution.)

We will measure the width of distributions by full width at half maximum (FWHM). In other words, we’ll measure how far apart the two points are where the distribution takes on half of its maximum value.

It’s not hard to calculate that the FWHM for a Cauchy distribution with scale 2γ and the FWHM for a normal distribution with scale σ is 2 √(2 log 2) σ.

If we have a convex combination of Cauchy and normal distributions, we’d expect the FWHM to be at least roughly the same convex combination of the FWHM of the separate distributions, i.e. we’d expect the FWHM of our mixture to be

2ηγ + 2(1 – η)√(2 log 2)σ.

How close is that guess to being correct? It has to be exactly correct when η is 0 or 1, but how well does it do in the middle? Here are a few experiments fixing γ = 1 and varying σ.

Acoustic roughness examples

Amplitude modulated signals sound rough to the human ear. The perceived roughness increases with modulation frequency, then decreases, and eventually disappears. The point where roughness reaches is maximum depends on the carrier signal, but for a 1 kHz tone roughness reaches a maximum for modulation at 70 Hz. Roughness also increases as a function of modulation depth.

Amplitude modulation multiplies a carrier signal by

1 + d sin(2π f t)

where d is the modulation depth, f is the modulation frequency, and t is time.

Here are some examples you can listen to. We use a pure 1000 Hz tone and Gaussian white noise as carriers, and vary modulation depth and frequency continuously over 10 seconds. he modulation depth example varies depth from 0 to 1. Modulation frequency varies from 0 to 120 Hz.

First, here’s a pure tone with increasing modulation depth.


Next we vary the modulation frequency.


Now we switch over to Gaussian white noise, first varying depth.


And finally white noise with varying modulation frequency. This one sounds like a prop-driven airplane taking off.


Related: Psychoacoustics consulting