Looking at the bits of a Unicode (UTF-8) text file

Suppose you type a little text into a text file, say “123”. If you open this file in a hex editor you’ll see

    3132 33

because the ASCII value for the character ‘1’ is 0x31 in hex, ‘2’ corresponds to 0x32, and ‘3’ corresponds to 0x33. If your file is saved as utf-8 rather than ASCII, it makes absolutely no difference, as long as the file is UTF-8 encoded. By design, UTF-8 is backward compatible with the first 128 ASCII characters.

Next, let’s add some Greek letters. Now our file contains “123 αβγ”. The lower-case Greek alphabet starts at 0x03B1, so these three characters are 0x03B1, 0x03B2, and 0x03B3. Now let’s look at the file in our hex editor.

    3132 3320 CEB1 CEB2 CEB3

The B1, B2, and B3 look familiar, but why do they have “CE” in front rather than “03”? This has to do with the details of UTF-8 encoding. If we looked at the same file with UTF-16 encoding, representing each character with 16 bits, the results look more familiar.

    FEFF 0031 0032 0033 0020 03B1 03B2 03B3

So our ASCII characters—1, 2, 3, and space—are padded with a couple zeros, and we see the Unicode values of our Greek letters as we expect. But what’s the FEFF at the beginning? That’s a byte order mark (BOM) that my text editor inserted. This is an invisible marker saying that the bytes are stored in big-endian mode.

Going back to UTF-8, the ASCII characters are more compact, i.e. no zero padding, but why to the Greek letters start with “CE”?

    3132 3320 CEB1 CEB2 CEB3

As I go into detail here, UTF-8 is a clever way to save space when representing mostly ASCII text. Since ASCII bytes start with 0, a byte starting with 1 signals that something special is happening and that the following bytes are to be interpreted differently.

In binary, 0xCE expands to

    11001110

I’ll color-code the bits to make it easier to talk about them.

    1 1 0 01110

The first 1 says that this byte does not simply represent a single character but is part of the encoding of a sequence of bytes encoding a character. The first 1 and the first 0, colored red, are bookends. The number of 1s in between, colored blue, says how many of the next bytes are part of this character. The bits after the first 0, colored black, are part of the character, and the rest follow in the next byte.

The continuation bytes begin with 10, and the remaining six bits are parts of a character. You know they’re not the start of a new character because there are no 1s between the first 1 and the first 0. With UTF-8, you can look at a byte in isolation and know whether it is an ASCII character, the beginning of a non-ASCII character, or the continuation of a non-ASCII character.

So now let’s look at 0xCEB1, with some spaces and colors added.

    1 1 0 01110 10 110001

The black bits, 01110110001, are the bits of our character, and the binary number 1110110001 is 0x03B1 in hex. So we get the Unicode value for α. Similarly the rest of the bytes encode β and γ.

It’s was a coincidence that the last two hex characters of our Greek letters were recognizable in the hex dump of the UTF-8 encoding. We’ll always see the last hex character of the Unicode value in the hex dump, but not always the last two.

For another example, let’s look at a higher Unicode value, U+FB31. This is בּ, the Hebrew letter bet with a dot in the middle. This shows up in a hex editor as

    EFAC B1

or in binary as

    111011111010110010110001

Let’s break this up as before.

    1 11 0 1111 10 101100 10 110001

The first bit is a 1, so we know we have some decoding to do. There are two 1s, colored blue, between the first 1 and the first 0, colored red. This says that the bits for our character, colored black, are stored in the remainder of the first byte and in the following two bytes.

So the bits of our character are

    1111101100110001

which in hex is 0xFB31, the Unicode value of our character.

More Unicode posts

How much do you really use?

I’ve been doing a little introspection lately about what software I use, not at an application level but at a feature level.

LaTeX

It started with looking at what parts of LaTeX I use. I wrote about this in April, and I revisited it this week in response to some client work [1]. LaTeX is second nature for me, so I figure that by now I’ve used a lot of its features.

Except I haven’t. When I searched my hard disk I found I’ve used a few hundred commands and a couple dozen packages. I’m fluent in LaTeX after using it for most of my life, but I don’t know it exhaustively. Far from it. Also, Pareto stuck his head in yet again: the 20% of commands I use most often account for about 80% of commands in my files.

Python

So next I started looking at what parts of Python I use by searching for import statements. I make heavy use of the usual suspects for applied math — numpy, scipy, sympy, matplotlib, etc. — but other than those I don’t use a lot of packages.

I was a little surprised to see that collections and functools are the non-mathematical packages I’ve used the most. A lot of the packages I’ve used have been hapax legomena, specialized packages I use one time.

Other tools

I imagine I’d get similar results if I looked at what parts of other programming languages and applications I use often. And for things I use less often, the percentage of features I use must be tiny.

When I needed to learn SQL, I took at look at the language standard. There were a bazillion statements defined in the standard, of which I may have used 10 by now. I imagine there are database gurus who haven’t used more than a few dozen statements.

Encouragement

I find all this encouraging because it means the next big, intimidating thing I need to learn probably won’t be that big in practice.

If you need to learn a new programming language and see that the “nutshell” book on the language is 1,500 pages, don’t be discouraged. The part you need to know may be fragments that amount to 30 pages, though it’s impossible to know in advance which 30 pages they will be.

Related posts

[1] I have a client that does a lot with org-mode. Rather than writing LaTeX files directly, they write org-mode files and export them to LaTeX. Although you can use LaTeX generously inside org-mode, you do have to do a few things a little differently. But it has its advantages.

  • Org has lighter markup and is easier to read.
  • You can run code inside an org file and have the source and/or the results inserted into the document.
  • Org cleans up after itself, deleting .aux files etc.
  • Org will automatically rerun the LaTeX compiler if necessary to get cross references right.
  • The outline features in org give you code folding.
  • You can export the same source to HTML or plain text if you’d like.

Make boring work harder

I was searching for something this morning and ran across several pages where someone blogged about software they wrote to help write their dissertations. It occurred to me that this is a pattern: I’ve seen a lot of writing tools that came out of someone writing a dissertation or some other book.

The blog posts leave the impression that the tools required more time to develop than they would save. This suggests that developing the tools was a form of moral compensation, procrastinating by working on something that feels like it’s making a contribution to what you ought to be doing.

Even so, developing the tools may have been a good idea. As with many things in life, it makes more sense when you ask “Compared to what“? If the realistic alternative to futzing around with scripts was to write another chapter of the dissertation, then developing the tools was not the best use of time, assuming they don’t actually save more time than they require.

But if the realistic alternative was binge watching some TV series, then writing the tools may have been a very good use of time. Any time the tools save is profit if the time that went into developing them would otherwise have been wasted.

Software developers are often criticized for developing tools rather than directly developing the code they’re paid to write. Sometimes these tools really are a good investment. But even when they’re not, they may be better than the realistic alternative. They may take time away from Facebook rather than time away from writing production code.

Another advantage to tool building, aside from getting some benefit from time that otherwise would have been wasted, is that it builds momentum. If you can’t bring yourself to face the dissertation, but you can bring yourself to write a script for writing your dissertation, you might feel more like facing the dissertation afterward.

Related post: Automate to save mental energy, not time

Sum of divisor powers

The function σk takes an integer n and returns the sum of the kth powers of divisors of n. For example, the divisors of 14 are 1, 2, 4, 7, and 14. If we set k = 3 we get

σ3(n) = 1³ + 2³ + 4³ + 7³ + 14³ = 3096.

A couple special cases may use different notation.

  • σ1(n) is the sum of the divisors of n and the function is usually written σ(n) with no subscript.

In Python you can compute σk(n) using divisor_sigma from SymPy. You can get a list of the divisors of n using the function divisors, so the bit of code below illustrates that divisor_sigma computes what it’s supposed to compute.

    n, k = 365, 4
    a = divisor_sigma(n, k)
    b = sum(d**k for d in divisors(n))
    assert(a == b)

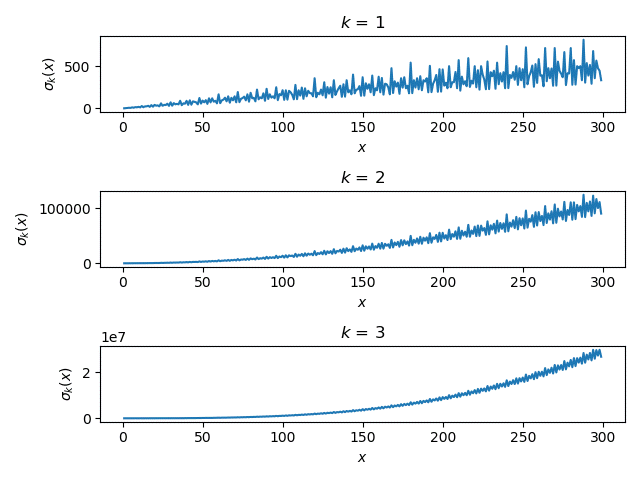
The Wikipedia article on σk gives graphs for k = 1, 2, and 3 and these graphs imply that σk gets smoother as k increases. Here is a similar graph to those in the article.

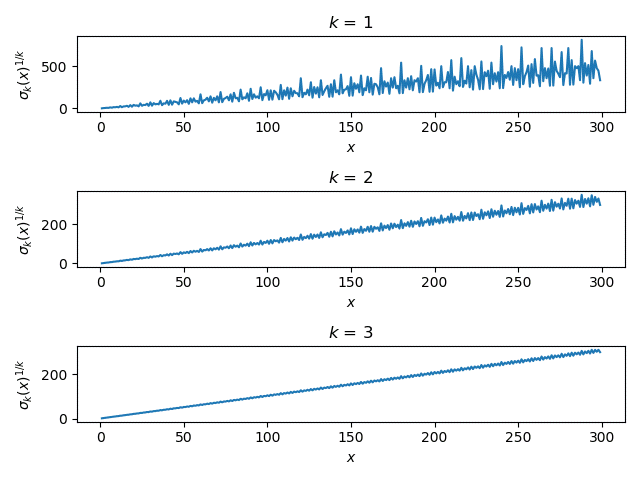
The plots definitely get smoother as k increases, but the plots are not on the same vertical scale. In order to make the plots more comparable, let’s look at the kth root of σk(n). This amounts to taking the Lebesgue k norm of the divisors of n.

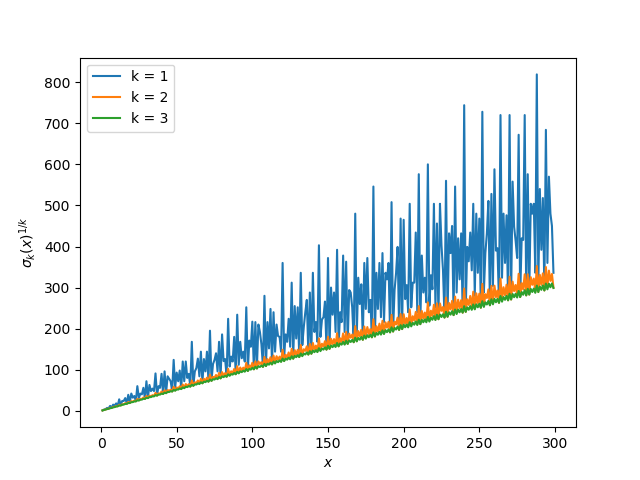
Now that the curves are on a more similar scale, let’s plot them all on a single plot rather than in three subplots.

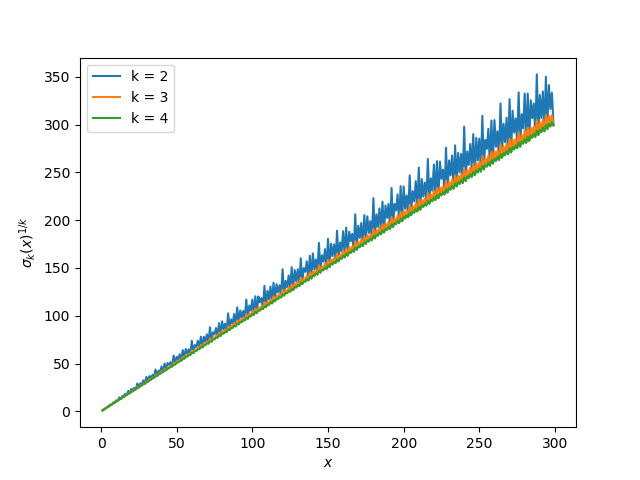
If we leave out k = 1 and add k = 4, we get a similar plot.

The plot for k = 2 that looked smooth compared to k = 1 now looks rough compared to k = 3 and 4.

An almost integer pattern in many bases

A few days ago I mentioned a passing comment in video by Richard Boucherds. This post picks up on another off-hand remark from that post.

Boucherds was discussing why exp(π √67) and exp(π √163) are nearly an integer.

exp(π √67) = 147197952744 – ε1
exp(π √163) = 262537412640768744 – ε2

where ε1 and ε2 and on the order of 10-6 and 10-12 respectively.

He called attention to the 744 at the end and commented that this isn’t just an artifact of base 10. In many other bases, these numbers end in that bases’ representation of 744. This is what I wanted to expand on.

To illustrate Boucherds’ remark in hexadecimal, note that

    147197952744 -> 0x2245ae82e8 
    262537412640768744 -> 0x3a4b862c4b402e8 
    744 -> 0x2e8 

Boucherds’ comment is equivalent to saying

147197952744 = 744 mod m

and

262537412640768744 = 744 mod m

for many values of m. Equivalently 147197952000 and 262537412640768000 have a lot of factors; every factor of these numbers is a base where the congruence holds.

So for how many bases m are these numbers congruent to 744?

The number of factors of a number n is written d(n). This is a multiplicative function, meaning that for relatively prime numbers a and b,

d(ab) = d(a) d(b).

Note that

147197952000 = 215 33 53 113

and

262537412640768000 = 218 33 53 233 293

It follows that

d(147197952000) =
d(215 33 53 113) =
d(215) d(33) d(53) d(113).

Now for any prime power pk

d(pk) = k + 1,

and so

d(147197952000) = 16 × 4 × 4 × 4.

Similarly

d(262537412640768000) = 19 × 4 × 4 × 4 × 4.

For more about almost integers, watch Boucherds’ video and see this post.

Org entities

This morning I found out that Emacs org-mode has its own markdown entities, analogous to HTML entities or LaTeX commands. Often they’re identical to LaTeX commands. For example, \approx is the approximation symbol ≈, exactly as in LaTeX.

So what’s the advantage of org-entities? In fact, how does Emacs even know whether \approx is a LaTeX command or an org entity?

If you use the command C-c C-x \ , Emacs will show you the compiled version of the entity, i.e. ≈ rather than the command \approx. This is global: all entities are displayed. The org entities would be converted to symbols if you export the file to HTML or LaTeX, but this gives you a way to see the symbols before exporting.

Here something that’s possibly surprising, possibly useful. The symbol you see is for display only. If you copy and paste it to another program, you’ll see the entity text, not the symbol. And if you C-c C-x \ again, you’ll see the command again, not the symbol; Note that the full name of the command is org-toggle-pretty-entities with “toggle” the middle.

If you use set-input-method to enter symbols using LaTeX commands or HTML entities as I described here, Emacs inserts a Unicode character and is irreversible. Once you type the LaTeX command \approx or the corresponding HTML entity ≈, any knowledge of how that character was entered is lost. So org entities are useful when you want to see Unicode characters but want your source file to remain strictly ASCII.

Incidentally, there are org entities for Hebrew letters, but only the first four, presumably because these are the only ones used as mathematical symbols.

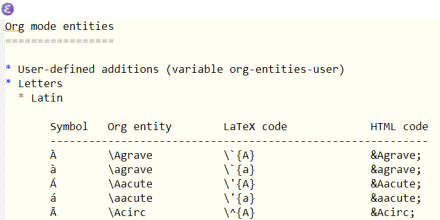
To see a list of org entities, use the command org-entities-help. Even if you never use org entities, the org entity documentation makes a nice reference for LaTeX commands and HTML entities. Here’s a screenshot of the first few lines.

First few lines of org-entities-help

Related posts

How big is the monster?

Voyager 1 photo of Jupiter. Jan. 6, 1979

Symmetries are captured by mathematical groups. And just as you can combine kinds symmetry to form new symmetries, you can combine groups to form new groups.

So-called simple groups are the building blocks of groups as prime numbers are the building blocks of integers [1].

Finite simple groups have been fully classified, and they fall into several families, with 26 exceptions that fall outside any of these families. The largest of these exceptional groups is called the monster.

The monster is very large, containing approximately 8 × 1053 elements. I saw a video by Richard Boucherds where he mentioned in passing that the number of elements in the group is a few orders of magnitude larger than the number of atoms in earth.

I tried to find a comparison that is closer to 8 × 1053 and settled on the number of atoms in Jupiter.

The mass of Jupiter is about 2 × 1027 kg. The planet is roughly 3/4 hydrogen and 1/4 helium by mass, and from that you can calculate that Jupiter contains about 1054 atoms.

Before doing my calculation with Jupiter, I first looked at lengths such as the diameter of the Milky Way in angstroms. But even the diameter of the observable universe in angstroms is far too small, only about 9 × 1036.

More on finite simple groups

[1] The way you build up groups from simple groups is more complicated than the way you build integers out of primes, but there’s still an analogy there.

The photo at the top of the post was taken by Voyager 1 on January 6, 1979.

Square waves and cobwebs

This is a follow-up to yesterday’s post. In that post we looked at iterates of the function

f(x) = exp( sin(x) )

and noticed that even iterations of f converged to a square wave. Odd iterates also converge to a square wave, but a different one. The limit of odd iterations is the limit of even iterations turned upside down.

Jan Van lint correctly pointed out in the comments

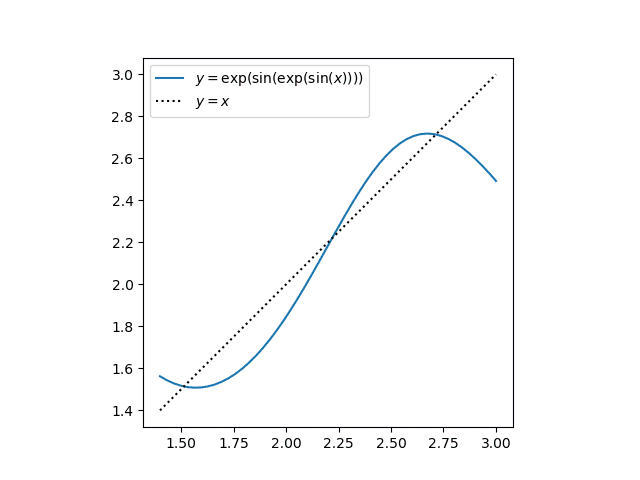
If you plot y=f(f(x)) and y=x, you can see that there are two stable fixed points, with one unstable fixed point in between.

Here’s the plot he describes.

You can see that there are fixed points between 1.5 and 2.0, between 2.0 and 2.5, and between 2.5 and 3. The following Python code will find these fixed points for us.

    from numpy import exp, sin
    from scipy.optimize import brentq

    def f(x): return exp(sin(x))
    def g(x): return f(f(x)) - x

    brackets = [(1.5, 2,0), (2.0, 2.5), (2.5, 3)]
    roots = [brentq(g, *b) for b in brackets]

This shows that the fixed points of g are

    1.514019042996987
    2.219107148913746
    2.713905124458644

If we apply f to each of these fixed points, we get the same numbers again, but in the opposite order. This is why the odd iterates and even iterates are upside-down from each other.

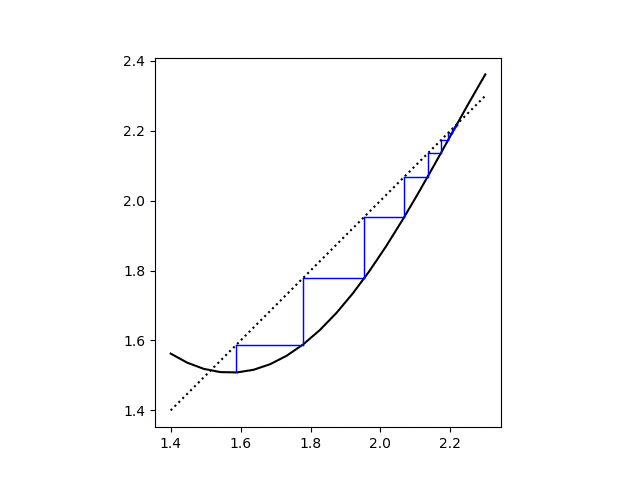
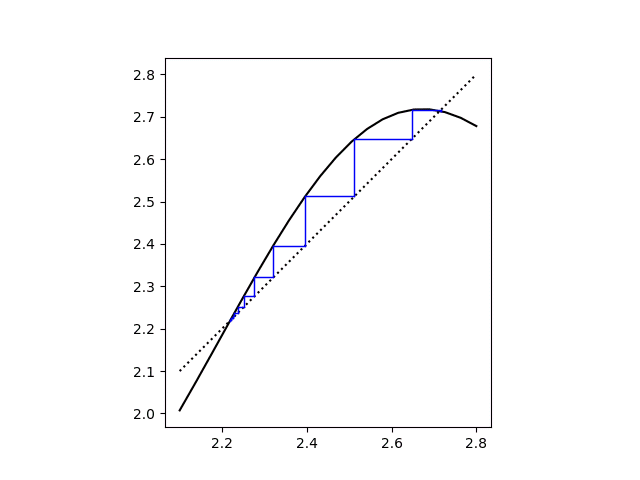
Next we’ll show a couple cobweb plots to visualize the convergence of the iterates. We’ll also show that the middle fixed point is unstable by looking at two iterations, one starting slightly below it and the other starting slightly above it.

The first starts at 2.2191 and progressed down toward the lower fixed point.

The second starts at 2.2192 and progresses up toward the upper fixed point.

Related posts

Unexpected square wave

Last night a friend from Vanderbilt, Father John Rickert, sent me a curious math problem. (John was a PhD student in the math department while I was a postdoc. He went on to become a Catholic priest after graduating.) He said that if you look at iterates of

f(x) = exp( sin(x) )

the plots become square.

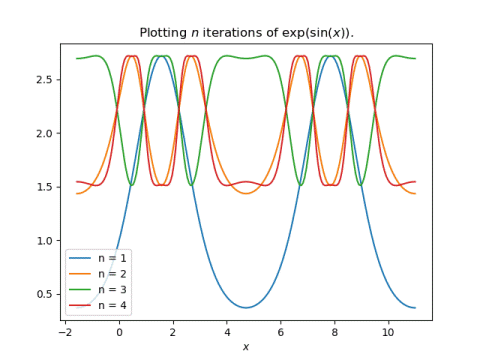
Here’s a plot to start the discussion, looking at f(x), f(f(x)), f(f(f(x))), and f(f(f(f(x)))).

One thing that is apparent is that there’s a big difference between applying f once and applying it at least two times. The former can range between 1/e and e, but the latter must be between exp(1/e) and e.

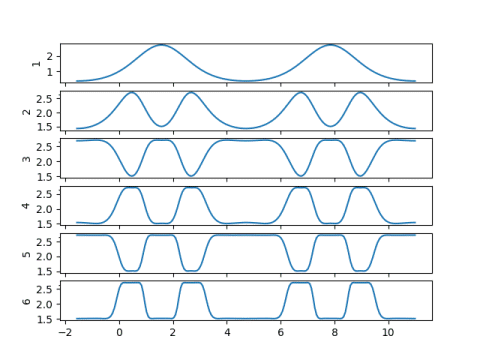
The plots overlap in a way that’s hard to understand, so let’s spread them out, plotting one iteration at a time.

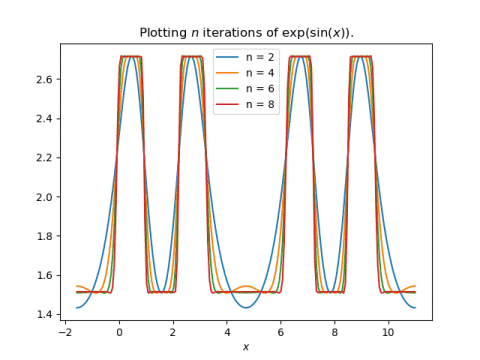
Now we can see the plots becoming flatter as the number of iterations increases. We can also see that even and odd iterations are roughly mirror images of each other. This suggests we should make a plot of at just even or just odd iterates. Here we go:

This shows more clearly how the plots are squaring off pretty quickly as the number of iterations increases.

My first thought when John showed me his plot was that it must have something to do with the contraction mapping theorem. And I suppose it does, but not in a simple way. The function f(x) is not a contraction mapping for any x. But f(f(x)) is a contraction mapping for some x, and further iterates are contractions for more values of x.

Update: See the next post calculates the fixed points of f(f(x)) and demonstrates how the stable fixed points converge and the unstable fixed point does not.

My second thought was that it would be interesting to look at the Fourier transform of these iterates. For any finite number of iterations, the result is a periodic, analytic function, and so eventually the Fourier coefficients must go to zero rapidly. But I suspect they initially go to zero slowly, like those of a square wave would. I intend to update this post after I’ve had a chance to look at the Fourier coefficients.

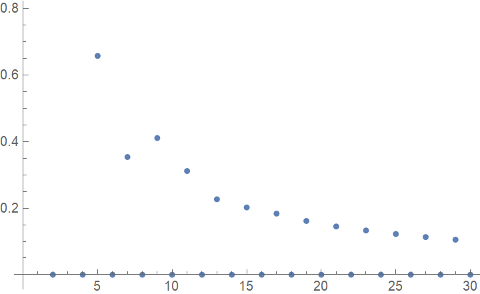
Update: As expected, the Fourier coefficients decay slowly. I plotted the Fourier sine coefficients for f(f(f(f(x)))) using Mathematica.

    f[x_] := Exp[Sin[x]]
    g[x_] := f[f[f[f[x]]]]
    ListPlot[ Table[
        NFourierSinCoefficient[g[x], x, i], 
        {i, 30}]
    ]

This produced the plot below.

The even-numbered coefficients are zero, but the odd-numbered coefficients are going to zero very slowly. Since the function g(x) is infinitely differentiable, for any k you can go far enough out in the Fourier series that the coefficients go to zero faster than nk. But initially the Fourier coefficients decay like 1/n, which is typical of a discontinuous function, like a square wave, rather than an infinitely differentiable function.

By the way, if you replace sine with cosine, you get similar plots, but with half as many flat spots per period.

Related posts

Not quite going in circles

foggy path

Sometimes you feel like you’re running around in circles, not making any progress, when you’re on the verge of a breakthrough. An illustration of this comes from integration by parts.

A common example in calculus classes is to integrate ex sin(x) using integration by parts (IBP). After using IBP once, you get an integral similar to the one you started with. And if you apply IBP again, you get exactly the integral you started with.

At this point you believe all is lost. Apparently IBP isn’t going to work and you’ll need to try another approach.

\begin{align*} \int e^x \sin x \, dx &= -e^x \cos x + \int e^x \cos x \, dx \\ &= e^x(\sin x - \cos x) - \int e^x \sin x \, dx\end{align*}

But then the professor pulls a rabbit out of a hat. By moving the integral on the right side to the left, you can solve for the unknown integral in terms of the debris IBP left along the way.

\int e^x \sin x \, dx = \frac{e^x}{2}(\sin x - \cos x)

So you weren’t going in circles after all. You were making progress when it didn’t feel like it.

It’s not that gathering unknowns to one side is a new idea; you would have seen that countless times before you get to calculus. But that’s not how integration usually works. You typically start with the assigned integral and steadily chip away at it, progressing in a straight line toward the result. The trick is seeing that a simple idea from another context can be applied in this context.

In the calculation above we first let u = ex and v’ = sin(x) on the left. Then when we come to the first integral on the right, we again set u = ex and this time v’ = cos(x).

But suppose you come to the second integral and think “This is starting to look futile. Maybe I should try something different. This time I’ll let ex be the v‘ term rather than the u term.” In that case you really will run in circles. You’ll get exactly the same expression on both sides.

It’s hard to say in calculus, or in life in general, whether persistence or creativity is called for. But in this instance, persistence pays off. If you set u to the exponential term both times, you win; if you switch horses mid stream, you lose.

Another way to look at the problem is that the winning strategy is to be persistent in your approach to IBP, but use your creativity at the end to realize that you’re nearly done, just when it may seem you need to start over.

If you’d like to read more about coming back where you started, see Coming full circle and then this example from signal processing.