Transformations of Olympic rings

The previous post gave the details of how Möbius transformations

m(z) = (az + b)/(cz + d)

transform circles. The image of a circle under a Möbius transformation is either a line or a circle, and in our examples the image will always be a circle.

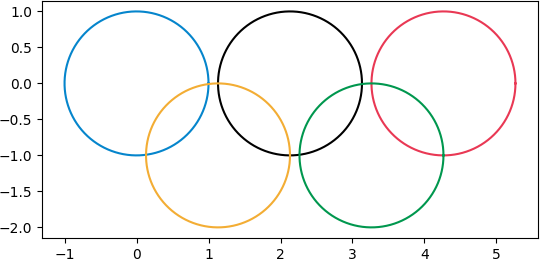
We start with an approximation of the Olympic rings


and then apply various transformations.

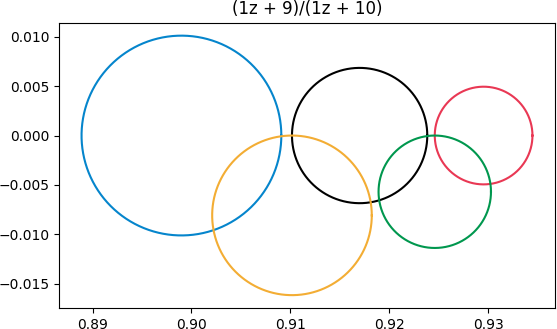
First we apply (z + 9)/(z + 10):


This transformation doesn’t distort the rings too much because the rings are far from the singularity at z = -10. The blue ring is distorted the most because it’s closest to the singularity.

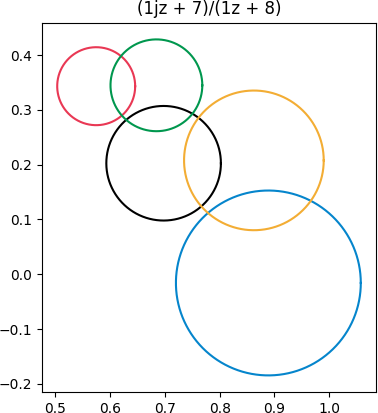
Next we apply (iz + 7)/(z + 8).  Now we’ve moved the singularity a little bit closer, and we caused some rotation by using i as the coefficient of z in the numerator.


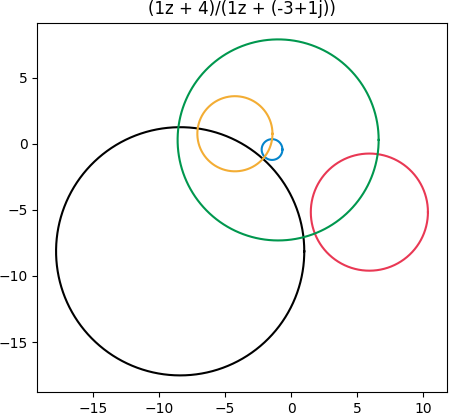
Finally, let’s pick a transformation with its singularity inside the green circle, (z + 4)/(z -3 + i).


Now we see a lot of distortion. The blue and gold rings that were outside the green ring are brought inside. The complex plane is turned inside-out because of the singularity.

As before, the black and red rings still intersect the green ring. But what you can’t tell from the graph is that the portion of these rings that was inside has been turned outside and vice versa.

Related posts

Circles and lines under a Möbius transformation

This post will revisit a previous post in more detail. I’ve written before about how Möbius transformations map circles and lines to circles and lines. In this post I’d like to explore how you’d calculate which circle or line a given circle or line goes to. Given an equation of a line or circle, what is the equation of its image?

Circles to circles

A while back I wrote a post called Circles to Circles, demonstrating how Möbius transformations map circles and lines to circles and lines. If you think of a line as a degenerate circle, a circle of infinite radius, then you could simply say Möbius transformations map circles to circles.

For example I showed in that post that the transformation

m(z) = (z + 2)/(3z + 4)

maps these circles

to these circles

and that these lines

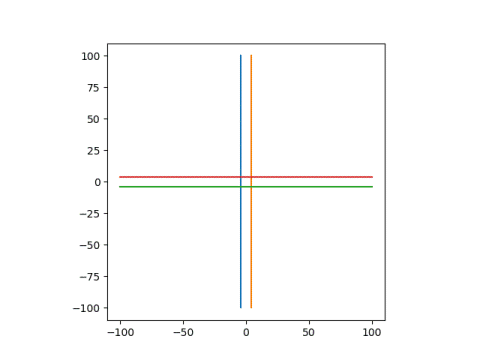
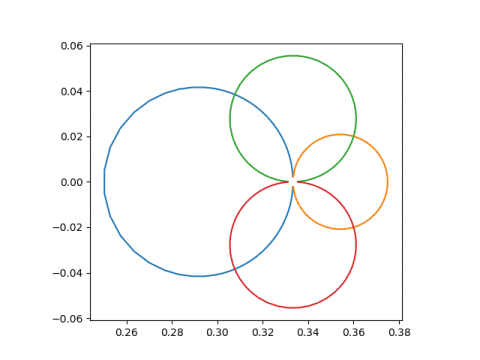
go to these circles

Circle or line image

Given the equation of a circle or a line, how would you know whether its image is a circle or a line?

A Möbius transformation

m(z) = (az + b) / (cz + d)

has a singularity at z = –d/c. If a line or curve goes through the point –d/c then its image is a line. Otherwise the image is a circle.

If the line or curve does go through –d/c, so that the image is a line, it’s easy to find an equation of the line. Pick two points, z1 and z2 on the original curve or line. Let w1m(z1) and w2m(z2). Then find the equation of a line through w1 and w2. For example, a parametric form is

w1 + t(w2w1)

for all real t.

Equation of the image circle

Now suppose we start with a circle centered at γ with radius r. We apply

m(z) = (az + b) / (cz + d)

as above, but we assume our circle does not pass through –d/c since that case is covered above. With this assumption we can conclude that the image of our circle is another circle, and the remaining task is to find an equation of that circle.

We can decompose our transformation m into several simpler steps—translation, reciprocal, rotation, and dilation—and see what happens to the center and radius under each step. The hardest step is taking the reciprocal, and this is covered in the previous post. That post was a lemma for this post.

We can apply m to z in four steps:

  1. Add d/c.
  2. Take the reciprocal.
  3. Multiply by e = (bcad)/c².
  4. Add a/c.

We know it’s OK to take the reciprocal in the second step because our circle does not contain the point z = –d/c.

We can break step 3 into (3a) multiplying by |e| and (3b) multiplying by e/|e|. Step 3a is a dilation and step 3b is a rotation.

Here’s a Python program using the steps above to find the center and radius of a transformed circle.

    def transform(a, b, c, d, center, radius):
        # step 1
        center += d/c

        # step 2
        temp = center
        center = np.conj(center) / (abs(center)**2 - radius**2)
        radius /= abs(abs(temp)**2 - radius**2)

        # step 3
        e = (b*c - a*d)/c**2
        center *= e
        radius *= abs(e)

        # step 4
        center += a/c

        return (center, radius)

Computing zeta at even numbers

Last year I wrote several posts about computing ζ(3) where ζ is the Riemann zeta function. For example, this post.

It happens that ζ can be evaluated in closed form at positive even arguments, but there’s still a lot of mystery about zeta at positive odd arguments.

There’s a way to derive ζ(2n) using contour integration. But you don’t need to be clever about constructing contours if you start from the following result which is derived using contour integration.

Suppose f is analytic except for poles at zk and that the sum

\sum_{n \ne z_k} f(n)

converges, where the sum is over all integer n except poles of f. Then the sum can be computed from residues at the poles:

 \sum_{n \ne z_k} f(n) = -\sum_{k} \text{Res}\left( f(z) \pi \cot \pi z; z_k \right)

Here Res stands for “residue.” The residue of a function g(z) at z0 is defined as the coefficient c-1 of (zz0)-1 in the Laurent series for g. Equivalently,

 c_{-1} = \lim_{z\to z_0} (z - z_0) g(z)

This means we can evaluate infinite sums by taking a limit that may be a simple application of L’Hôpital’s rule.

The theorem above could be used to calculate a lot more than values of the Riemann zeta function by choosing various functions f, but for our purposes f(z) will be z-2m for some positive integer m.

\zeta(2m) = \sum_{n=1}^\infty \frac{1}{n^{2m}} = \frac{1}{2} \sum_{\stackrel{n=-\infty}{n\ne 0} }^\infty \frac{1}{n^{2m}} = -\frac{1}{2}\,\text{Res}\left( \frac{\pi \cot \pi z}{z^{2m}}; 0 \right )

Why can’t this same trick be used for evaluating the Riemann zeta function at odd integer arguments? The second equality above fails. For even powers of n, the sum over the positive integers is half the sum over all integers. For odd powers, the sum over all integers is zero.

If we write out the Laurent series for π cot πz then we can read off the residues of π cot πz/z2m.

\pi \cot \pi z = \frac{1}{z}-\frac{\pi ^2 z}{3}-\frac{\pi ^4 z^3}{45}-\frac{2 \pi ^6 z^5}{945} - \cdots

When we divide by z² the coefficient of z becomes the coefficient of z-1, i.e. the residue. This residue is -π²/3, and so negative one half of this is π²/6, i.e. ζ(2) = π²/6.

The same line of reasoning shows that ζ(4) = π4/90 and ζ(6) = π6/945.

Finding the values of ζ(2m) in general is no harder than finding the power series for cotangent, which is not trivial but not insurmountable either. See this post.

The final result is that

\zeta(2m) = (-1)^{m-1} 2^{2m-1} \pi^{2m} \frac{B_{2m}}{(2m)!}

Constructive Picard

The previous post concerned the function

h(z) = exp(-1/(1 – z² )).

We said that the function is badly behaved near -1 and 1. How badly?

The function has essential singularities at -1 and 1. This means that not only does h blow up near these points, it blows up spectacularly.

Picard’s theorem says that if a meromorphic function f has an essential singularity at z0, then near z0 the function takes on every value in the complex plane infinitely often. That’s almost true: Picard’s theorem says f can miss one point.

Suppose we take a little disk around 1 and a complex number w. Then Picard’s theorem says that there are infinitely many solutions to the equation

h(z) = w

inside the disk, except possibly for one value of w. Since the exponential function is never 0, we know that 0 is the one value h cannot take on. So for any non-zero w, we can find an infinite number of solutions to the equation above.

OK, so let’s actually do it. Let’s pick a w and look for solutions. Today’s June 24, so let’s pick w = 6 + 24i. We want to find solutions to

exp(-1/(1 – z²)) = 6 + 24i.

Taking the log of both sides, we need to find values of z such that

-1/(1 – z²) = log(6 + 24i)

This step should make you anxious. You can’t just take logarithms of complex numbers willy nilly. Which value of the logarithm do you mean? If we pick the wrong logarithm values, will we still get solutions to our equation?

Let’s back up and say what we mean by a logarithm of a complex number. For a non-zero complex number z, a logarithm of z is a number w such that exp(w) = z. Now if z is real, there is one real solution w, hence we can say the logarithm in the context of real analysis. But since

exp(w + 2πin) = exp(w)

for any integer n, we can add a multiple of 2πi to any complex logarithm value to get another.

Now let’s go back and pick a particular logarithm of 6 + 24i. We’ll use the “principal branch” of the logarithm, the single-valued function that extends the real logarithm with a branch cut along the negative real axis. This branch is often denoted Log with a capital L. We have

Log(6 + 24i) = 3.20837 + 1.32582i.

When we take the logarithm of both sides of the equation

exp(-1/(1 – z²)) = 6 + 24i.

we get an infinite sequence of values on both sides:

in – 1/(1 – z²) = 2πim + Log(6 + 24i)

for integers n and m. For each fixed value of n and m the equation above is a quadratic equation in z and so we can solve it for z.

Just to make an arbitrary choice, set n = 20 and m = 22. We can then ask Mathematica to take solve for z.

    NSolve[40 Pi I - 1/(1 - z^2) == 44 Pi I Log[6 + 24 I], z]

This gives two solutions:

z = -0.99932 + 0.00118143i

and

z = 0.99932 – 0.00118143i.

In hindsight, of course one root is the negative of the other, because h is an even function.

Now we don’t need n and m in

in – 1/(1 – z²) = 2πim + Log(6 + 24i)

because we can consolidate the move 2πim to the left side and call nm the new n. Or to put it another way, we might as well let m = 0.

So our solutions all have the form

in – Log(6 + 24i) = 1/(1 – z²)

z² = 1 + 1/(Log(6 + 24i) – 2πin).

The larger n gets, the closer z gets to 1. So this shows constructive what Picard said would happen: we have a sequence of solutions converging to 1, so no matter how small a neighborhood we take around 1, we have infinitely many solutions in that neighborhood, i.e. h(z) = 6 + 24i infinitely often.
No analytic bump

The word “smooth” in mathematics usually means infinitely differentiable. Occasionally the word is used to mean a function has as many derivatives as necessary, but without being specific about how many derivatives that is.

A function is analytic if it has a convergent power series representation at every point of its domain. An analytic function is infinitely differentiable, but surprisingly the converse is not true.

Suppose we took a bump function as described in the previous post, say over the interval [-1, 1]. Such a function would be infinitely differentiable at 1, positive to the left of 1 and zero to the right. Let’s compute the power series centered at 1. All the derivatives are zero at 1, so all the power series coefficients are 0, so the power series sums to 0. The bump function is positive on the left side of 1 but the power series is not.

When does the power series of an infinitely differentiable function converge to that function? More on this subtle question here.

Now suppose we forge ahead and try to construct an analytic bump function. What goes wrong? Do we get something that is almost analytic?

Let’s follow the construction of the previous post, starting with

f(x) = exp(x).

Then

g(x) = 1 /f(1/x) = exp(-1/x)

and

h(x) = g(1+x) g(1-x) = exp(1/(1 – x²))

In Mathematica,

    h[x_] := If[Abs[x] < 1, Exp[-1/(1 - x^2)], 0]

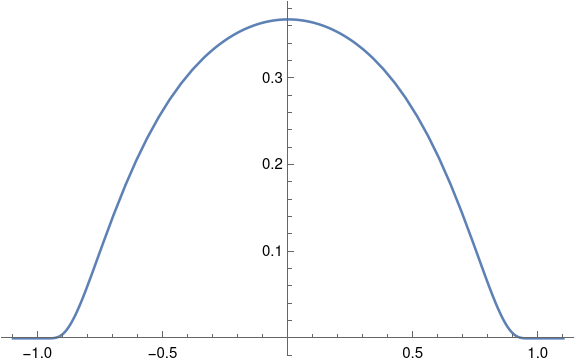
Now let’s look at h from several perspectives. Along the real axis, everything is fine.

    Plot[h[x], {x, -1.1, 1.1}]

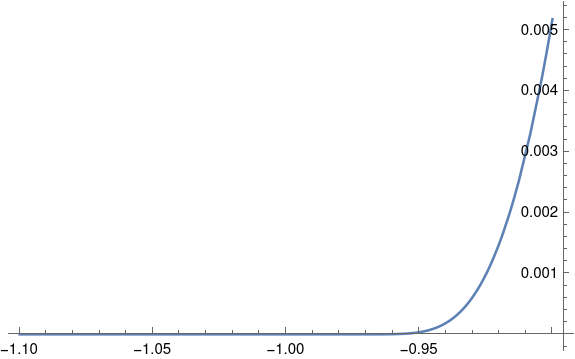
The function seems to drop to zero abruptly so that it might not be smooth, but zooming in a little reassures us that the function is indeed smooth.

    Plot[h[x], {x, -1.1, -0.9}, PlotRange -> All]

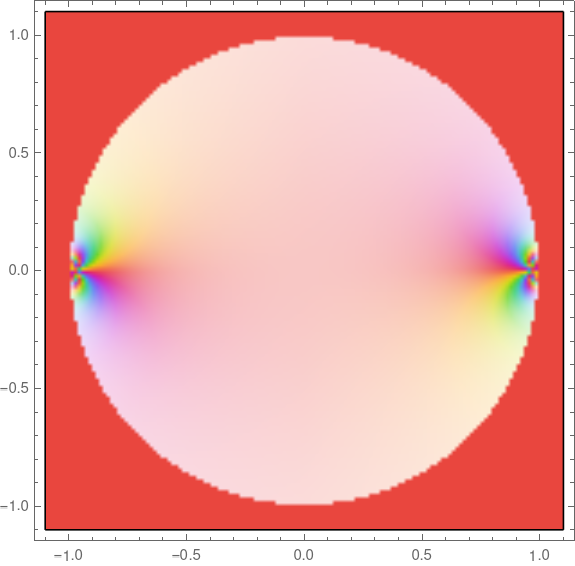
What if we plot h as a complex function?

Now things don’t look so smooth. The swirls of color near -1 and 1 show that the phase is changing violently. Also, the light color in the unit circle compared to the dark color outside suggests the phase jumps when we cross the unit circle rather than smoothly transitioning to zero.

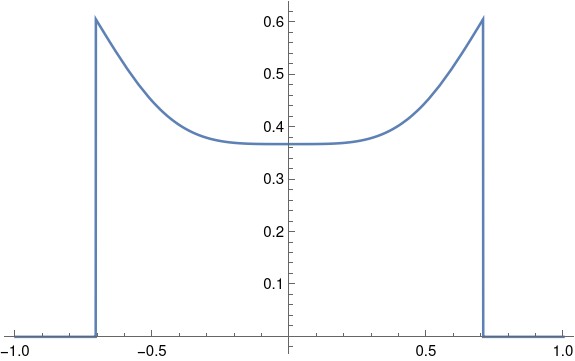
Let’s see what happens to the magnitude of h as we cut across the square above diagonally.

    Plot[Abs[h[z I + z]], {z, -1, 1}]

Definitely not smooth. Not even continuous.

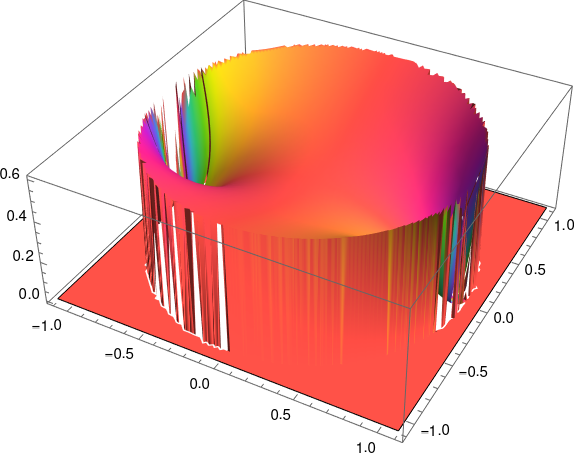
Let’s see what happens if we add a dimension to our plot, using |h(z)| as height.

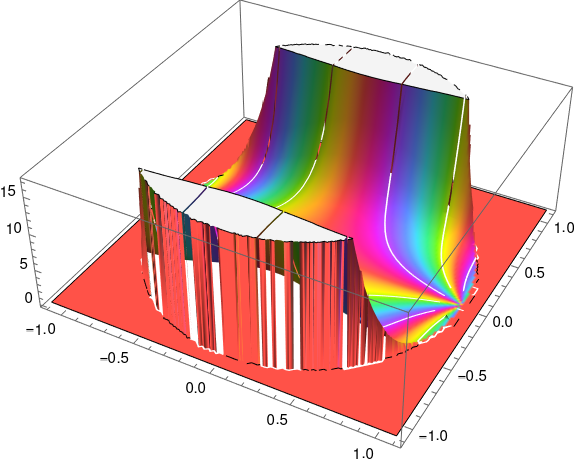
    ComplexPlot3D[h[z], {z, -1.1 - 1.1 I, 1.1 + 1.1 I}]

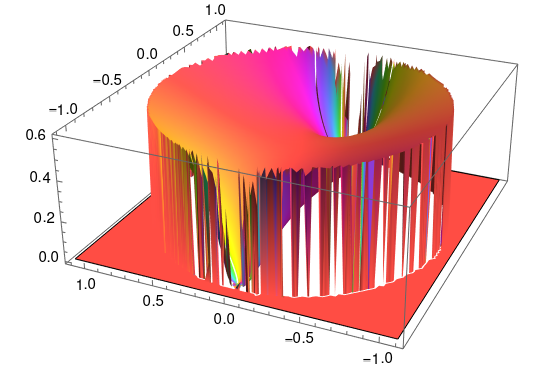
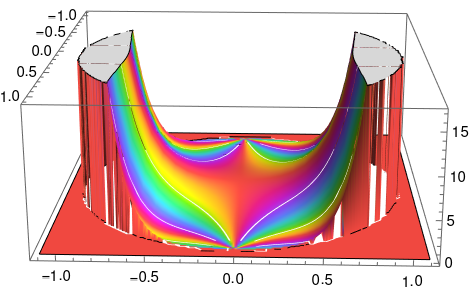
So a lot is happening at ±1. Let’s turn this plot around to look at it from a different perspective.

Our function has essential singularities at ±1 when we look at it in the complex plane. Along the real axis everything looks fine, but when we look at it from the complex plane we see that the function is very badly behaved.

Before we go, let’s go back and look at the example from the previous post, a bump function that is six derivatives along the real axis. What would it look like extended to the complex plane?

    h2[z_] := If[Abs[z] < 1, (1 + z)^7 (1 - z)^7, 0]
    ComplexPlot3D[h2[z], {z, -1.1 - 1.1 I, 1.1 + 1.1 I}]

This gives us

Here's the same plot viewed from a different angle.

Doubly periodic but not analytic

A sine wave is the canonical periodic function, so an obvious way to create a periodic function of two variables would be to multiply two sine waves:

f(x, y) = sin(x) sin(y)

This function is doubly periodic: periodic in the horizontal and vertical directions.

Now suppose you want to construct a doubly periodic function of a complex variable z = x + iy. One thing you might try is

f(x + iy) = sin(x) sin(y)

This is a function of a complex variable, technically, but it’s not what we usually have in mind when we speak of functions of a complex variable. We’re usually interested in complex functions that are differentiable as complex functions.

If h is the increment in the definition of a derivative, we require the limit as h approaches 0 to be equal no matter what route h takes. On the real line, h could go to zero from the left or from the right. That’s all the possibilities. But in the complex plane, h could approach the origin from any angle, or it could take a more complex route such as spiraling toward 0.

It turns out that it is sufficient that the limit be the same whether h goes to 0 along the real or imaginary axis. This gives us the Cauchy-Riemann equations. If

f(x, y) = u(x, y) + i v(x, y)

then the Cauchy-Riemann equations require the partial derivative of u with respect to x to equal the partial derivative of v with respect to y, and the partial derivative of v with respect to x to be the negative of the partial of u with respect to y.

ux = vy
vx = –uy

These equations imply that if v = 0 then u is constant. A real-valued function of a complex variable cannot be analytic unless its constant.

So can we rescue our example by making up an imaginary component v? If so

f(x, y) = sin(x) sin(y) + i v(x, y)

would have to satisfy the Cauchy-Riemann equations. The first equation would require

v(x, y) = – cos(x) cos(y) + a cos(x)

for some constant a, but the second would require

v(x, y) =  cos(x) cos(y) + cos(y)

for some constant b. Note the negative sign in the former but not in the latter. I’ll leave it as an exercise for the reader to show that these requirements are contradictory.

Liouville’s theorem says that a bounded analytic function must be constant. If an analytic function f is doubly periodic, then it must either be constant or have a singularity. There are many such functions, known as elliptic functions.

Related posts

Exponential of a line

Draw a line in the complex plane. What is the image of that line when you apply the exponential function?

A line through w with direction z is the set of points w + tz where w and z are complex and t ranges over the real numbers. The image of this line is

exp(w+ tz) = exp(w) exp(tz)

and we can see from this that character of the image mostly depends on z. We can first plot exp(tz) then rotate and stretch or shrink the result by multiplying by exp(w).

If z is real, so the line is horizontal, then the image of the line is a straight line.

If z is purely imaginary, so the line is vertical, then the image of the line is a circle.

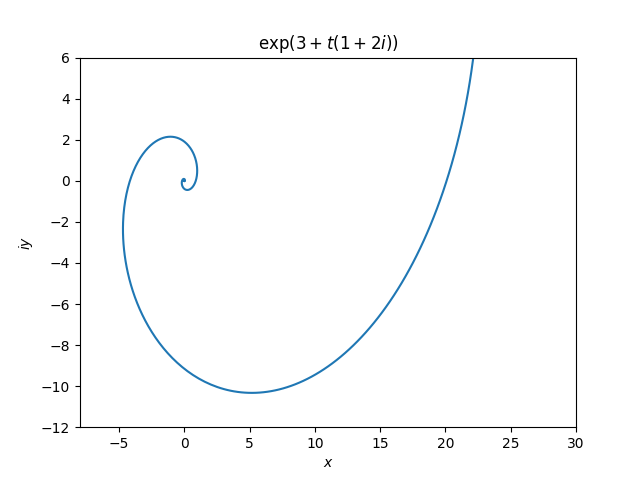
But for a general value of z, corresponding to neither a perfectly horizontal nor perfectly vertical line, the image is a spiral.

Since the imaginary part of z is not zero, the image curves. And since the real part of z is not zero, the image spirals into the origin, either as t goes to infinity or to negative infinity, depending on the sign of the real part of z.

Here’s an example, the image of the line through (3, 0) with slope 2.

exponential spiral plot

Random Blaschke products and Mathematica binding

A Blaschke product is a function that is the product of Blaschke factors, functions of the form

b(z; a) = |a|  (a – z) / a (1 – a*z)

where the complex number a lies inside the unit circle and a* is the complex conjugate of a.

I wanted to plot Blaschke products with random values of a using Mathematica, and I ran into a couple items of interest.

First, although Mathematica has a function RandomComplex for returning complex numbers chosen by a pseudorandom number generator, this function selects complex numbers uniformly over a rectangle and I wanted to select uniformly over a disk. This is easy enough to get around. I wrote my own function by selecting a magnitude and phase at random.

    rc[] := Sqrt[RandomReal[]] Exp[-2 Pi I RandomReal[]]

Now if I reuse the definition of a Blaschke factor from an earlier post

    b[z_, a_] := (Abs[a]/a) (a - z)/(1 - Conjugate[a] z)

I can define a product of two random Blaschke factors as follows.

    f[z_] := b[z, rc[]]  b[z, rc[]]

However, this may not do what you expect. If you plot the function twice, you’ll get different results! It’s a matter of binding order. At what point in the process are the two random values of a chosen and fixed? The answer is some time between the definition of f and executing the plotting function. If the plotting function generated new values of a every time it needed to evaluate f the result would be a hot mess.

On the other hand, if we leave out the colon then the function f behaves as expected.

    f[z_] = b[z, rc[]]  b[z, rc[]]

Now random values are generated by each call to rc, and these values are frozen in the definition of f.

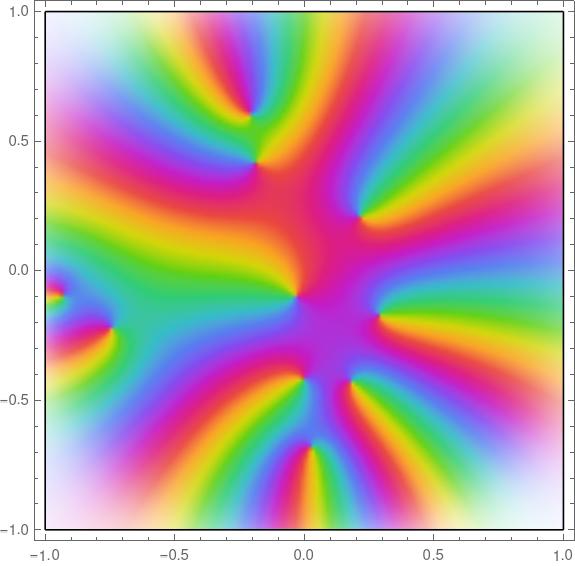
Here’s a Blaschke product with 10 random parameters.

    f[z_] = Product[b[z, rc[]], {i, 1, 10}]

The code

    ComplexPlot[f[z], {z, -1 - I, 1 + I}]

produces the following plot.

If I plot this function again, say changing the plot range, I’ll plot the same function. But if I execute the line of code defining f again, and call ComplexPlot again, I’ll generate a new function.

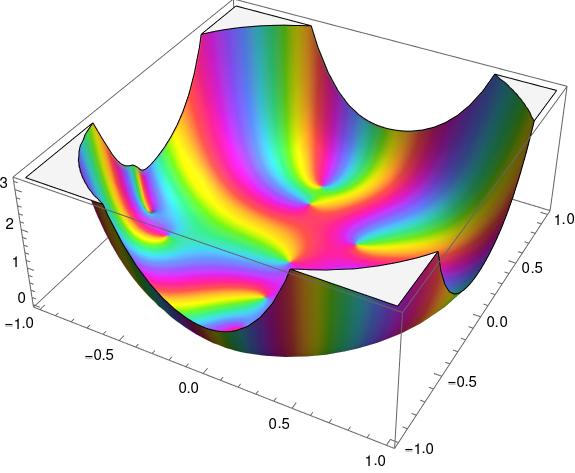
Incidentally, if I plot this same function using ComplexPlot3d I get the following.

Why does it look like a bowl? As explained in the post on Blaschke factors, each factor is zero at its parameter a and has a pole at the reflection of a in the unit disk.

The function plotted above has zeros inside the unit disk near the boundary. That means it also has poles outside the unit disk near the boundary on the other side.

Fixed points of bilinear transformations

Introduction

I was puzzled the first time I saw bilinear transformations, also known as Möbius transformations. I was in a class where everything had been abstract and general, and suddenly thing got very concrete and specific. I wondered why we had changed gears, and I wondered how there could be much to say about something so simple.

A bilinear transformation f has the form

f(z) = \frac{az + b}{cz + d}

where adbc ≠ 0.

The answer to my questions, which I did not realize at the time, was that bilinear transformations come up very often in applications, if not directly then indirectly as useful tools. For example, the electrical engineer’s Smith chart is a bilinear transformation. Also, most of the mental math tricks given here amount to bilinear approximations. And the Blaschke factors I wrote about yesterday are bilinear transformations.

Fixed points

For this post I want to look at fixed points of bilinear transformations, solutions to f(x) = x where f is as above. This amounts to solving a quadratic equation.

The locations of the fixed points are

\frac{a - d \pm \sqrt{\Delta}}{2c}

where

\Delta = (a + d)^2 - 4(ad-bc)

The trace of the transformation is a + d, and the trace classifies the transformation into one of three categories: parabolic, elliptic, or loxodromic.

The trace could be any number in the complex plane, and all values of the trace correspond to the loxodromic case except when the trace is a real number in the interval [-2, 2].

In the loxodromic case there are two distinct fixed points: one attractive and one repulsive.

Example

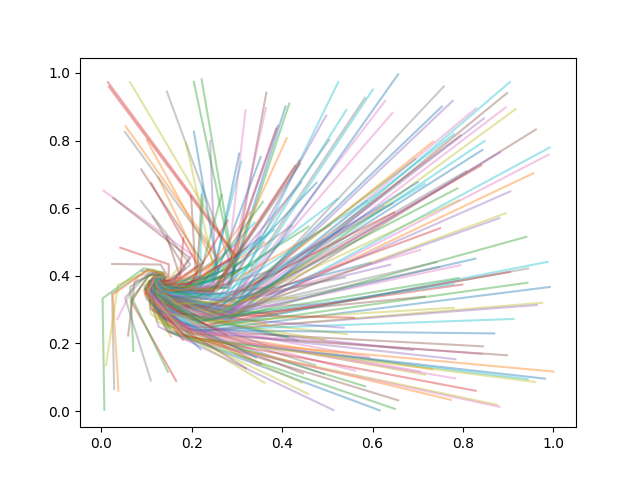
In this example I chose a = 1, b = i, c = 2, and d = 3. The two fixed points are at 0.136 + 0.393i and -1.136 – 0.393i.

I chose 200 starting points at random in the unit square and iterated the binlinear function. This produced the following graph.

So apparently 0.136 + 0.393i is the attracting fixes point.

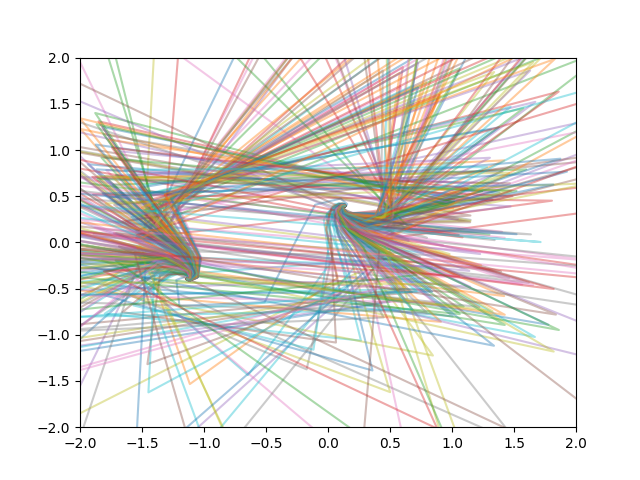
Next I started at 200 random starting points in a tight neighborhood of -1.136 – 0.393i., all within 0.00001 of the fixed point. This produced the following graph.

If you start exactly on the repelling fixed point, you’ll stay there forever. But if you start a tiny distance away from this point you’ll end up at the attracting fixed point.


Blaschke factors

Blaschke factors are complex functions with specified zeros inside the unit disk. Given a complex number a with |a| < 1, the Blaschke factor associated with a is the function

b(z; a) = \frac{|a|}{a} \frac{a-z}{1 -\bar{a}z}

Notice the semicolon in b(z; a). This is a convention that a few authors follow, and that I wish more would adopt. From a purely logical perspective the semicolon serves no purpose because the expression on the right is a function of two variables, z and a. But the semicolon conveys how we think about the function: we think of it as a function of z that depends on a parameter a.

So, for example, if we were to speak of the derivative of b, we would mean the derivative with respect to z. And we could say that that b is an analytic function inside the unit disk. It is not an analytic function if we think of it as a function of a because of taking the conjugate of a in the denominator.

The function b(z; a) has a zero at a and a pole at the reciprocal of the conjugate of a. So, as I wrote about yesterday, this means that the zero and the pole are inversions of each other in the unit circle. If you punch a hole in the complex plane at the origin and turn the plane inside-out, without moving the unit circle, the zero and pole will swap places.

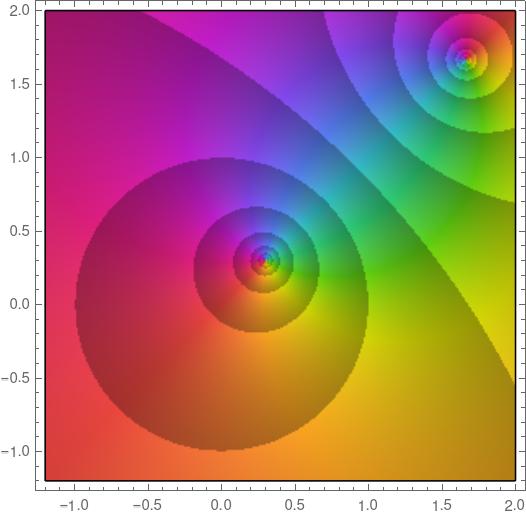
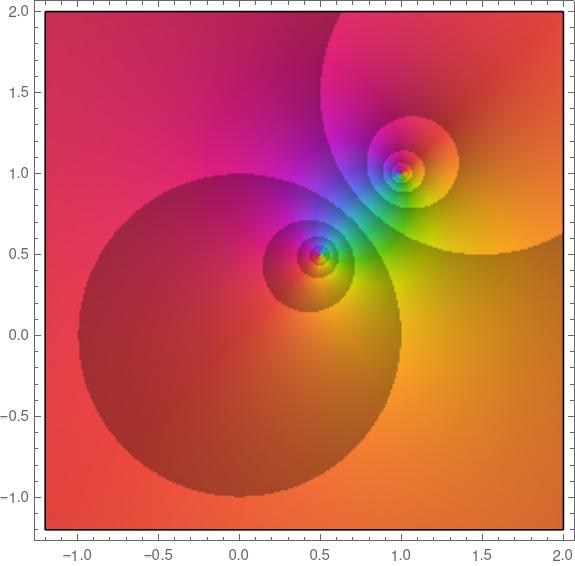
Here’s a plot of b(z; 0.3 + 0.3i).

Notice there’s a zero at 0.3 + 0.3i and a pole at

1/(0.3 – 0.3i) = 5/3 + 5/3i

which is the inversion of 0.3 + 0.3i in the unit circle. You can tell that one is a zero and the other is a pole because the colors rotate in opposite directions.

The plot above was made with the following Mathematica code.

    b[z_, a_] := (Abs[a]/a) (a - z)/(1 - Conjugate[a] z)
    ComplexPlot[b[z, .3 + .3 I], {z, -1.2 - 1.2 I, 2 + 2 I}, 
        ColorFunction -> "CyclicLogAbs"]

Because the zero and pole locations are inversions of each other, as the zero moves closer to the unit circle from the inside, the pole moves closer to the unit circle from the outside. Here’s a plot with a = 0.5 + 0.5i.

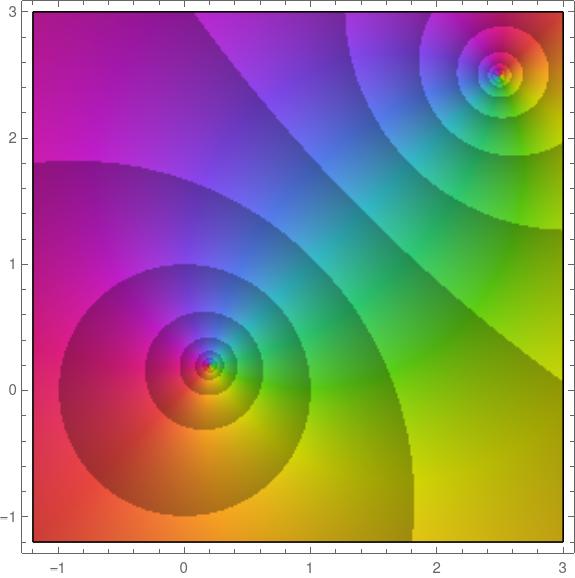
And the closer the zero gets to the origin, the further out the pole moves. Here’s a plot with a = 0.2 + 0.2i, this time on a larger scale, this time with the real and imaginary axes going up to 3 rather than 2.

Blaschke factors are the building blocks of Blaschke products, something I intend to write about in the future. By multiplying Blaschke factors together, you can create function that is analytic in the unit disk with specified zeros and with other nice properties.

Elias Wegert [1] says “In some sense, Blaschke products can be considered to be ‘hyperbolic counterparts’ of polynomials.” That’s something I’d like to explore further.

Related posts

[1] Elias Wegert. Visual Complex Functions: An Introduction with Phase Portraits. Birkhäuser.