Beta-binomial with given mean and variance

The previous post looked at an application of the beta-binomial distribution. The probability mass function for a beta-binomial with parameters n, a, and b is given by

\text{Prob}(X = x) = \binom{n}{x} \frac{B(x + a, n - x + b)}{B(a, b)}

The mean μ and the variance σ² are given by

\begin{align*} \mu &= \frac{na}{a+b} \\ \sigma^2 &= \frac{nab(a + b + n)}{(a+b)^2(a + b + 1)} \end{align*}

Solving for a and b to meet a specified mean and variance appears at first to require solving a cubic equation, but it’s easier than that.

If we define p = a/(a+b) then the system becomes

\begin{align*} \mu &= np \\ \sigma^2 &= n p (1-p)\frac{a + np}{a + b} \end{align*}

We assume n is known and so p is known, and we are left with a linear equation for a. With a little work we find

\begin{align*} a &= -\frac{\mu(\mu^2 - \mu n + \sigma^2)}{\mu^2 - \mu n + \sigma^2 n} \\ b &= \frac{a(n - \mu)}{\mu} \end{align*}

I verified the calculations above with Mathematica.

One use for solving for a and b would be to fit a beta-binomial distribution to data using moment matching. I don’t know how robust this would be, but at least it’s something.

Another application would be to find a beta-binomial prior distribution with elicited mean and variance.

Babies and the beta-binomial distribution

About half of children are boys and half are girls, but that doesn’t mean that every couple is equally likely to have a boy or a girl each time they conceive a child. And evidence suggests that indeed the probability of conceiving a girl varies per couple.

I will simplify things for this post and look at a hypothetical situation abstracting away the complications of biology. This post fills in the technical details of a thread I posted on Twitter this morning.

Suppose the probability p that a couple will have a baby girl has a some distribution centered at 0.5 and symmetric about that point. Then half of all births on the planet will be girls, but that doesn’t mean that a particular couple is equally likely to have a boy or a girl.

How could you tell the difference empirically? You couldn’t if every family had one child. But suppose you studied all families with four children, for example. You’d expect 1 in 16 such families to have all boys, and 1 in 16 families to have all girls. If the proportions are higher than that, and they are, then that suggests that the distribution on p, the probability of a couple having a girl, is not constant.

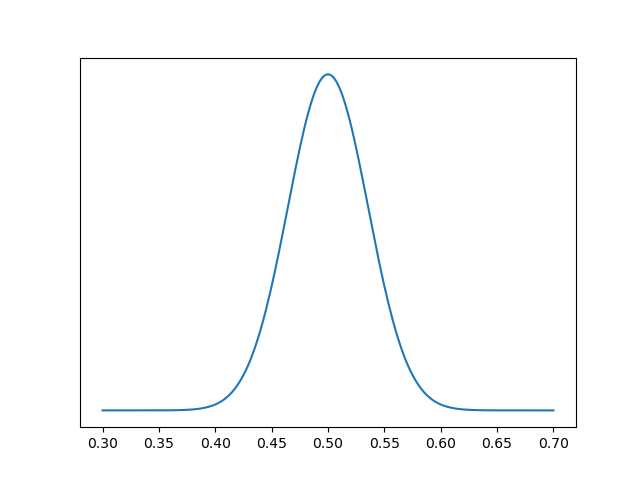
Suppose the probability of a couple having girls has a beta(a, b) distribution. We would expect a and b to be approximately equal, since about half of babies are girls, and we’d expect a and b to be large, i.e. for the distribution be fairly concentrated around 1/2. For example, here’s a plot with ab = 100.

Then the probability distribution for the number of girls in a family of n children is given by a beta-binomial distribution with parameters n, a, and b. That is, the probability of x girls in a family of size n is given by

\text{Prob}(X = x) = \binom{n}{x} \frac{B(x + a, n - x + b)}{B(a, b)}

The mean of this distribution is na/(a+b). And so if a = b then the mean is n/2, half girls and half boys.

But the variance is more interesting. The variance is

\frac{nab(a + b + n)}{(a + b)^2(a + b +1)} = n \,\,\frac{a}{a + b} \,\,\frac{b}{a + b} \,\,\frac{a + b + n}{a + b + 1}

The variance of a binomial, corresponding to a constant p, is np(1-p). In the equation above, p corresponds to a/(a+b), and (1-p) corresponds to b/(a+b). And there’s an extra term,

\frac{a + b + n}{a + b + 1}

which is larger than 1 when n > 1. This says a beta binomial random variable always has more variance than the corresponding binomial distribution with the same mean.

Now suppose a family has had n children, with g girls and ng boys. Then the posterior predictive probability of a girl on the next birth is

\frac{a + g}{a + b + n}

If g = n/2 then this probability is 1/2. But if g > n/2 then the probability is greater than 1/2. And the smaller a and b are, the more the probability exceeds 1/2.

The binomial model is the limit of the beta-binomial model as a and b go to infinity (proportionately). In the limit, the probability above equals a/(a+b), independent of g and n.

Related posts

Reviewing a thousand things

Suppose you’ve learned a thousand of something, maybe a thousand kanji or a thousand chemicals or a thousand species of beetles. Now you want to review them to retain what you’ve learned.

Now suppose you have a program to quiz you, drawing items from your list at random with replacement. Say you draw 100 items a day. How long until you’ve seen everything at least once?

A naive estimate would be 10 days, but that assumes you never draw the same item twice in 1000 draws. According to the birthday problem principle, there’s a 50-50 chance you’ll see a duplicate by the time you’ve made √1000 ≈ 32 draws. Drawing 100 cards a day, you’ll likely see duplicates the first day.

Coupon collector problem

Random sampling with replacement is not an efficient way to exhaustively sample a large population. The coupon collector problem says that for a set of N items, the expected number of draws before you’ve seen everything once is approximately

N(log N + γ)

for large N. Here γ is Euler’s constant. When N = 1000 this works out to 7485. So if you draw 100 items a day, you’d expect to have seen everything after 75 days. Of course it might take more or less time than that, but that’s the average.

To put it another way, random sampling with replacement is about 7.5 times less efficient than systematic sampling if you’re concerned with expected time to exhaustive sampling.

In general, the relative inefficiency is log N + γ. So for a set of N = 100 things, for example, the relative inefficiency is about 5.2.

Occupancy problem

We can arrive at approximately the same result using methods from a couple other posts. Last week I wrote about the occupancy problem distribution. That post defined X(N, r) and gives its mean and variance.

When we draw r random samples with replacement from a set of N items, let X(N, r) be the random variable that represents the number of distinct items in the sample. …

The mean of X(N, r) is

N\left( 1 - \left(\frac{N-1}{N}\right)^r \right)

So if we have set of N = 1000 things and sample with replacement 7000 times, we expect to see 999 distinct items on average. Of course this is an average, so we might see less. And we might see more, but not much more!

Probabilities

The approaches above have worked with expected values, not individual probabilities. The coupon collector problem looks at the expected number of draws needed to before you see everything. The occupancy problem looks at the expected number of things you’ve seen after a certain number of draws.

We could calculate the probability of having seen everything after r draws using the expression here.

After 7,000 draws, there’s a 40% chance we’ve seen everything. After 7,274 draws the chances of having seen everything are even, i.e. the median number of draws is 7,274, not that different from the mean number of draws estimated above.

After 10,000 draws there is a 96% chance we’ve seen everything.

For more on the distribution of the number of draws necessary, see the follow-on post Collecting a large number of coupons.

A note on computation

The expression used in the previous section relies on Stirling numbers, and these are a bit difficult to compute. The calculation involves very large integers, but we cannot use logarithms because we are adding large numbers, not multiplying them.

This post includes Python code for calculating Stirling numbers using Python’s large integer feature. But the probability we’re after is the ratio of two integers too large to convert to floating point numbers. The following code gets around this problem using the Decimal class.

    from math import comb, log10
    from decimal import Decimal, getcontext

    def k_factorial_stirling(n, k):
        return sum((-1)**i * comb(k, i)*(k-i)**n for i in range(k+1))    

    def prob(N, r):
        getcontext().prec = int(r*log10(N)) + 100
        return Decimal( k_factorial_stirling(r, N) ) / Decimal( N**r)

    print( round(prob(1000,  7000), 4) )
    print( round(prob(1000,  7274), 4) )
    print( round(prob(1000, 10000), 4) )

How do we know how many decimal places we’ll need? We’re computing a probability, so the denominator is larger than the numerator. We estimate the number of digits in the denominator, then throw in 100 more just for good measure.

Occupancy problem distribution

Suppose you have a random number generator that returns numbers between 1 and N. The birthday problem asks how many random numbers would you have to output before there’s a 50-50 chance that you’ll repeat a number. The coupon collector problem asks how many numbers you expect to generate before you’ve seen all N numbers at least once.

These are examples of occupancy problems. The name comes from imagining N urns, randomly assigning balls to each, then asking how many urns are occupied.

Suppose people are walking into a room one at a time. The birthday problem asks at what point is there even odds that two people in the room have the same birthday. The coupon collector problem asks the expected number of people to enter the room before all birthdays are represented. But we could ask, for example, after 100 people enter the room, how likely it is that there are 70 different birthdays represented.

When we draw r random samples with replacement from a set of N items, let X(N, r) be the random variable that represents the number of distinct items in the sample. For example, suppose a hashing algorithm returns one of N possible hash codes. The number of distinct hash codes after hashing r documents would be X(N, r).

The probability mass function (pmf) for X(N, r) has been calculated, for example in [1], but it’s very complicated and you’re not likely to get much understanding of X(N, r) by looking at the expression for the pmf. The mean and variance of X(N, r) are somewhat complicated [2], but easier to work with than the pmf.

The mean of X(N, r) is

N\left( 1 - \left(\frac{N-1}{N}\right)^r \right)

In the special case that N = r and N is large, the mean is approximately N(1 – 1/e). For example, suppose you had a deck of 52 cards. You draw one card, put it back in the deck, and shuffle the deck. Repeat this 52 times. You would get about 33 distinct cards on average.

The variance of X(N, r) is more complicated than the mean.

\frac{(N-1)^r}{N^{r-1}} + \frac{(N-1)(N-2)^r}{N^{r-1}} - \frac{(N-1)^{2r}}{N^{2r-2}}

As with the mean, the case N = r with N large is simpler. In that case the variance is approximately N(1/e – 1/e²). In the example above, this works out to about 12. The standard deviation is about 3.5, and so you’d often see 33 ± 7 distinct cards.

Related posts

[1] Paul G. Hoel, Sidney C. Port, and Charles J. Stone, Introduction to Probability TheoryX(N, r), Houghton Mifflin, Boston, 1971, pp. 43–45.

[2] Emily S. Murphree. Replacement Costs: The Inefficiencies of Sampling with Replacement. Mathematics Magazine, Vol. 78, No. 1 (Feb., 2005), pp. 51-57.

Hypergeometric distribution symmetry

One of these days I’d like to read Feller’s probability book slowly. He often says clever things in passing that are easy to miss.

Here’s an example from Feller [1] that I overlooked until I saw it cited elsewhere.

Suppose an urn contains n marbles, n1 red and n2 black. When r marbles are drawn from the urn, the probability that precisely k of the marbles are red follows a hypergeometric distribution.

\frac{\binom{n_1}{k}\binom{n-n_1}{r-k}} {\binom{n}{r}}

Feller mentions that this expression can be rewritten as

 \frac{\binom{r}{k} \binom{n-r}{n_1 - k}} { \binom{n}{n_1} }

What just happened? The roles of the total number of red marbles n1 and the sample size r, have been swapped.

The proof is trivial—expand both expressions using factorials and observe that they’re equal—but that alone doesn’t give much insight. It just shows that two jumbles of symbols represent the same quantity.

The combinatorial interpretation is more interesting and more useful. It says that you have two ways to evaluate the probability: focusing on the sample or focusing on the population of red marbles.

The former perspective says we could multiply the number of ways to choose k marbles from the supply of n1 red marbles and rk black marbles from the supply of nn1 black marbles, then divide by the number of ways to choose a sample of r marbles from an urn of n marbles.

The latter perspective says that rather than partitioning our sample of r marbles, we could think of partitioning the population of red marbles into two groups: those included in our sample and those not in our sample.

I played around with adding color to make it easier to see how the terms move between the two expressions. I colored the number of red marbles red and the sample size blue.

\[ \frac{\binom{{\color{red} n_1}}{k}\binom{n-{\color{red} n_1}}{{\color{blue} r}-k}} {\binom{n}{{\color{blue}r}}} = \frac{\binom{{\color{blue} r}}{k} \binom{n-{\color{blue} r}}{{\color{red} n_1} - k}} { \binom{n}{{\color{red} n_1}} } \]

Moving from left to right, the red variable goes down and the blue variable goes up.

Related posts

[1] William Feller. An Introduction to Probability Theory and Its Applications. Volume 1. Third edition. Page 44.

Contraharmonic mean

I’ve mentioned the harmonic mean multiple times here, most recently last week. The harmonic mean pops up in many contexts.

The contraharmonic mean is a variation on the harmonic mean that comes up occasionally, though not as often as its better known sibling.

Definition

The contraharmonic mean of two positive numbers a and b is

C = \frac{a^2 + b^2}{a + b}

and more generally, the contraharmonic mean of a sequence of positive numbers is the sum of their squares over their sum.

Why the name?

What is “contra” about the contraharmonic mean? The harmonic mean and contraharmonic mean have a sort of reciprocal relationship. The ratio

\frac{a - m}{m - b}

equals a/b when m is the harmonic mean and it equals b/a when m is the contraharmonic mean.

Geometric visualization

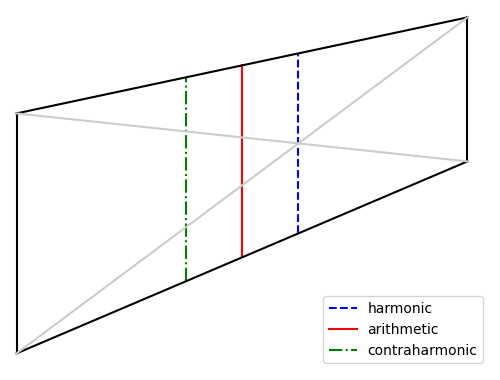
Construct a trapezoid with two vertical sides, one of length a and another of length b. The vertical slice through the intersection of the diagonals, the dashed blue line in the diagram below, has length equal to the harmonic mean of a and b.

The vertical slice midway between the two vertical sides, the solid red line in the diagram, has length equal to the arithmetic mean of a and b.

The vertical slice on the opposite side of the red line, as from the red line on one side as the blue line is on the other, the dash-dot green line above, has length equal to the contraharmonic mean of a and b.

Connection to statistics

The contraharmonic mean of a list of numbers is the ratio of the sum of the squares to the sum. If we divide the numerator and denominator by the number of terms n we see this is the ratio of the second moment to the first moment, i.e. the mean of the squared values divided the mean of the values.

This smells like the ratio of variance to mean, known as the index of dispersion D, except variance is the second central moment rather than the second moment. The second moment equals variance plus the square of the mean, and so

D = \frac{\sigma^2}{\mu}

and

C = \frac{\text{E}(X^2)}{\text{E}(X)} = \frac{\sigma^2 + \mu^2}{\mu} = D + \mu.

Expected distance between points in a cube

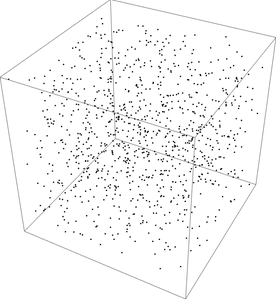
random samples from a cube

Suppose you randomly sample points from a unit cube. How far apart are pairs of points on average?

My intuition would say that the expected distance either has a simple closed form or no closed form at all. To my surprise, the result is somewhere in between: a complicated closed form.

Computing the expected value by simulation is straight forward. I’ll make the code a little less straight forward but more interesting and more compact by leveraging a couple features of NumPy.

    import numpy as np

    dimension = 3
    reps = 10000

    cube1 = np.random.random((reps, dimension))
    cube2 = np.random.random((reps, dimension))
    distances = np.linalg.norm(cube1 - cube2, axis=1)
    print(distances.mean())

This gives a value of 0.6629. This value is probably correct to two decimal places since the Central Limit Theorem says our error should be on the order of one over the square root of the number of reps.

In fact, the expected value given here is

\frac{4}{105} + \frac{17}{105}\sqrt{2} - \frac{2}{35}\sqrt{3} + \frac{1}{5}\log(1 + \sqrt{2}) + \frac{2}{5}\log(2 + \sqrt{3}) - \frac{1}{15}\pi

which evaluates numerically to 0.661707….

The expression for the expected value is simpler in lower dimensions; it’s just 1/3 in one dimension. In higher dimensions there is no closed form in terms of elementary functions and integers.

Incidentally, the image above was made using the following Mathematica code.

    pts = RandomPoint[Cube[], 10^3];
    Graphics3D[{PointSize[Small], Point[pts], Opacity[0.3]}, Boxed -> True]

Beta approximation to binomial

It is well-known that you can approximate a binomial distribution with a normal distribution. Of course there are a few provisos …

Robin Williams imitating William F. Buckley

It is also well-known that you can approximate a beta distribution with a normal distribution as well.

This means you could directly approximate a binomial distribution with a beta distribution. This is a trivial consequence of the two other approximation results, but I don’t recall seeing this mentioned anywhere.

Why would you want to approximate a binomial distribution with a beta? The normal distribution is better known than the beta, and the normal approximation is motivated by the central limit theorem. However, approximating a binomial distribution by a beta makes the connection to Bayesian statistics clearer.

Let’s look back at a post I wrote yesterday. There I argued that the common interpretation of a confidence interval, while unjustified by the theory that produced it, could be justified by appealing to Bayesian statistics because a frequentist confidence interval, in practice, is approximately a Bayesian credible interval.

In that post I give an example of estimating a proportion p based on a survey with 127 positive responses out of 400 persons surveyed. The confidence interval given in that post implicitly used a normal approximation to a binomial. This is done so often that it typically goes unnoticed, and it is justified for large samples when p is not too close to 0 or 1.

Binomial distributions with large n are difficult to work with and it is more convenient to work with continuous distributions. Instead of the normal approximation, we could have used a beta approximation. This has nothing to do with Bayesian statistics yet. We could introduce the beta distribution simply as an alternative to the normal distribution.

The distribution on the estimated rate is binomial with p = 127/400 and variance p(1-p)/n with n = 400.

We could compare this to a beta distribution with the same mean and variance. I worked out here how to solve beta distribution parameters that lead to a specified mean and variance. If we do that with the mean and variance above we get a = 126.7 and b = 272.3. We could then find a 95% confidence interval by finding the 2.5 and 97.5 percentiles for a beta(126.7, 272.3) distribution. When we do, we get a confidence interval of (0.2728, 0.3639), very nearly what we got in the earlier post using a normal approximation.

At this point we have been doing frequentist statistics, using a beta distribution as a computational convenience. Now let’s put on our Bayesian hats. Starting with a uniform, i.e. beta(1, 1), prior, we get a posterior distribution on the proportion we’re estimating which has a beta(128, 274).

If you plot the density functions of a beta(126.7, 272.3) and a beta(128, 274) you’ll see that they agree to within the thickness of a line.

Related posts

First names and Bayes’ theorem

Is the woman in this photograph more likely to be named Esther or Caitlin?

black and white photo of an elderly woman

Yesterday Mark Jason Dominus published wrote about statistics on first names in the US from 1960 to 2021. For each year and state, the data tell how many boys and girls were given each name.

Reading the data “forward” you could ask, for example, how common was it for girls born in 1960 to be named Paula. Reading the data “backward” you could ask how likely it is that a woman named Paula was born in 1960.

We do this intuitively. When you hear a name like Blanche you may think of an elderly woman because the name is uncommon now (in the US) but was more common in the past. Sometimes we get a bimodal distribution. Olivia, for example, has made a comeback. If you hear that a female is named Olivia, she’s probably not middle aged. She’s more likely to be in school or retired than to be a soccer mom.

Bayes’ theorem tells us how to turn probabilities around. We could go through Mark’s data and compute the probabilities in reverse. We could quantify the probability that a woman named Paula was born in the 1960s, for example, by adding up the probabilities that she was born in 1960, 1961, …, 1969.

Bayes theorem says

P(age | name) = P(name | age) P(age) / P(name).

Here the vertical bar separates the thing we want the probability of from the thing we assume. P(age | name), for example, is the probability of a particular age, given a particular name.

There is no bar in the probability in the denominator above. P(name) is the overall probability of a particular name, regardless of age.

People very often get probabilities backward; they need Bayes theorem to turn them around. A particular case of this is the prosecutor’s fallacy. In a court of law, the probability of a bit of evidence given that someone is guilty is irrelevant. What matters is the probability that they are guilty given the evidence.

In a paternity case, we don’t need to know the probability of someone having a particular genetic marker given that a certain man is or is not their father. We want to know the probability that a certain man is the father, given that someone has a particular genetic marker. The former probability is not what we’re after, but it is useful information to stick into Bayes’ theorem.

Related posts

Photo by Todd Cravens on Unsplash.

Famous constants and the Gumbel distribution

The Gumbel distribution, named after Emil Julius Gumbel (1891–1966), is important in statistics, particularly in studying the maximum of random variables. It comes up in machine learning in the so-called Gumbel-max trick. It also comes up in other applications such as in number theory.

For this post, I wanted to point out how a couple famous constants are related to the Gumbel distribution.

Gumbel distribution

The standard Gumbel distribution is most easily described by its cumulative distribution function

F(x) = exp( −exp(−x) ).

You can introduce a location parameter μ and scale parameter β the usual way, replacing x with (x − μ)/β and dividing by β.

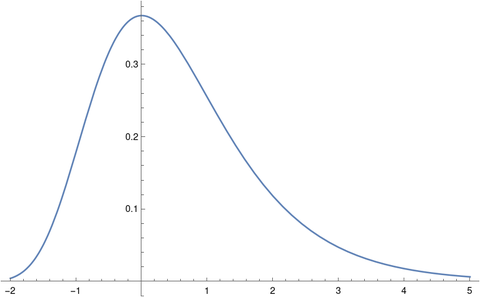
Here’s a plot of the density.

Euler-Mascheroni constant γ

The Euler-Mascheroni constant γ comes up frequently in applications. Here are five posts where γ has come up.

The constant γ comes up in the context of the Gumbel distribution two ways. First, the mean of the standard Gumbel distribution is γ. Second, the entropy of a standard Gumbel distribution is γ + 1.

Apéry’s constant ζ(3)

The values of the Riemann zeta function ζ(z) at positive even integers have closed-form expressions given here, but the values at odd integers do not. The value of ζ(3) is known as Apéry’s constant because Roger Apéry proved in 1978 that ζ(3) is irrational.

Like the Euler-Mascheroni constant, Apéry’s constant has come up here multiple times. Some examples:

The connection of the Gumbel distribution to Apéry’s constant is that the skewness of the distribution is

12√6 ζ(3)/π³.