Plotting constellations

Suppose you wanted to write a program to plot constellations. This leads down some interesting rabbit trails.

When you look up data on stars in constellations you run into two meanings of constellation. For example, Leo is a region of the night sky containing an untold number of stars. It is also a pattern of nine particular stars connected by imaginary lines. It’s easier to find data on the former, say sorted by brightness.

Are the nine brightest stars in Leo-the-region the nine stars of Leo-the-stick-figure? Not exactly, but close.

Wikipedia has an article that list stars in each constellation region, and star charts that have constellations as stick figures. If the stars on the chart are labeled, you can cross reference them with Wikipedia.

On a particular star chart I have, the stars in Leo are labeled with their Bayer designation. Roughly speaking the Bayer designation labels the stars within a constellation with Greek letters in descending order of brightness, but there are inconsistencies. The nomenclature goes back to Johann Bayer (1572–1625) and has its flaws.

The stars in Leo, in line-drawing order, are

  1. δ Leo
  2. Denebola (β Leo)
  3. θ Leo
  4. Regulus (α Leo)
  5. η Leo
  6. γ Leo
  7. ζ Leo
  8. μ Leo
  9. ε Leo

You can look up the coordinates of these stars here. Line-drawing order does not correspond to brightness order, so without a labeled star chart you’d have some research to do. My chart labels all the stars in Leo (the stick figure), but not, for example, in Virgo.

γ Leo is actually two stars, and Wikipedia ranks the brightness of the stars a little differently than Bayer did, which is understandable since brightness could not be objectively measured in his day. Wikipedia also inserts a few stars in between the stars listed above.

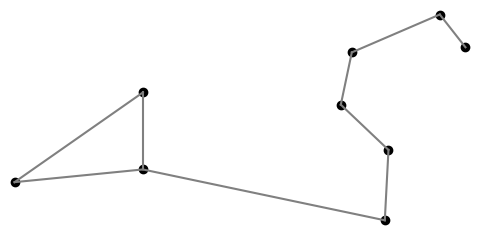
Here’s a plot of Leo using the data referenced above.

Alien astronomers and Benford’s law

alien astronomer image created by DALL-E

In 1881, astronomer Simon Newcomb noticed something curious. The first pages in books of logarithms were dirty on the edge, while the pages became progressively cleaner in later pages. He inferred from this that people more often looked up the logarithms of numbers with small leading digits than with large leading digits.

Why might this be? One might reasonably expect the numbers that came up in work to be uniformly distributed. But as often the case, it helps to ask “Uniform on what scale?”

Newcomb might have imagined his counterpart on another planet. This alien astronomer might have 12 fingers [1] and count in base 12. Base 10 is not inevitable, even for creatures with 10 fingers: the ancient Sumerians used a base-60 number system.

If Newcomb’s twelve-fingered counterpart had developed logarithms but not digital computers, he might have tables of duodecimal logarithms bound into books, and he too might noticed that pages with small leading (duo)digits are more frequently referenced. Both astronomers would naturally look up the logarithms of physical constants, physical distances, and so fort, numbers that vary over a practically unlimited range. The unlimited range is important.

On what scale could both astronomers see the leading digits uniformly distributed?

If Newcomb needed to look up the logarithms of numbers over a limited range, say from 1 to 106, each with equal probability, then the leading digits would be uniformly distributed. But our alien astronomer would have no special interest in the number 106. He might want to look at numbers between 1 and 126. The leading digits of numbers over this range would be uniformly distributed when represented in base 12, but not when represented in base 10. The choice of upper limit introduces a bias in one base or another.

Now suppose the numbers that both astronomers used in their work were uniformly distributed on a logarithmic scale. Newcomb conjectured that the numbers that came up in practice were uniformly distributed in their logarithms base 10. Our alien astronomer might conjecture the same thing for logarithms base 12. And both could be right. So would a third astronomer working in base 42. All logarithms are proportional, and so numbers uniformly distributed on a log scale using one base are uniformly distributed on a log scale using any other base.

Benford’s law says that the leading digits of numbers that come up in practice are uniformly distributed on a log scale. This applies to base 10, but also any other base, such as base 100. If you looked at the first two digits and thought of them as single base-100 digits, Benford’s law still applies.

But who is Benford? True to Stigler’s law of eponymy, Newcomb’s observation is named after physicist Frank Benford who independently made the same observation in 1938 and who tested it more extensively.

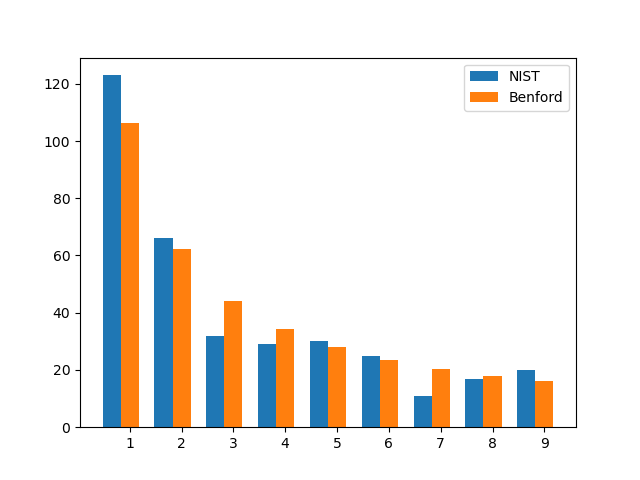
Let’s look at a set of physical constants and see how well Benford’s law applies. I took at list of physical constants from NIST and made a histogram of the leading digits to compare with what one would expect from Benford’s law.

If one were to write the NIST constants in base 12 and repeat the exercise, the result would look similar.

Related posts

[1] The image at the top of the post was created by DALL-E. There is a slight hint of an extra finger. DALL-E usually has a hard problem with hands, adding or removing fingers. But my attempts to force it to draw a hand with an extra finger were not successful.

Dutton’s Navigation and Piloting

This morning Eric Berger posted a clip from The Hunt for Red October as a meme, and that made me think about the movie.

I watched Red October this evening, for the first time since around the time it came out in 1990, and was surprised by a detail in one of the scenes. I recognized one of the books: Dutton’s Navigation and Piloting.

Screen shot with Dutton's Navigation and Piloting

I have a copy of that book, the 14th edition. The spine looks exactly the same. The first printing was in 1985, and I have have the second printing from 1989. So it is probably the same edition and maybe even the same printing as in the movie. I bought the book last year because it was recommended for something I was working on. Apparently it’s quite a classic since someone thought that adding a copy in the background would help make a realistic set for a submarine.

My copy has a gold sticker inside, indicating that the book came from Fred L. Woods Nautical Supplies, though I bought my copy used from Alibris.

Here’s a clip from the movie featuring Dutton’s.

Dutton’s has a long history. From the preface:

Since the first edition of Navigation and Nautical Astronomy (as it was then titled) was written by Commander Benjamin Dutton, U. S. Navy, and published in 1926, this book has been updated and revised. The title was changed after his death to more accurately reflect its focus …

The 14th edition contains a mixture of classical and electronic navigation, navigating by stars and by satellites. It does not mention GPS; that is included in the latest edition, the 15th edition published in 2003.

Related posts

The NBA and MLB trees are isomorphic

NBA MLB games

An isomorphism is a structure-preserving function from one object to another. In the context of graphs, an isomorphism is a function that maps the vertices of one graph onto the vertices of another, preserving all the edges.

So if G and H are graphs, and f is an isomorphism between G and H, nodes x and y are connected in G if and only if nodes f(x) and f(y) are connected in H.

There are 30 basketball teams in the National Basketball Association (NBA) and 30 baseball teams in Major League Baseball (MLB). That means the NBA and MLB are isomorphic as sets, but it doesn’t necessarily mean that the hierarchical structure of the two organizations are the same. But in fact the hierarchies are the same.

Both the NBA and MLB have two top-level divisions, each divided into three subdivisions, each containing five teams.

Basketball has an Eastern Conference and a Western Conference, whereas baseball has an American League and a National League. Each basketball conference is divided into three divisions, just like baseball leagues, and each division has five teams, just as in baseball. So the tree structures of the two organizations are the same.

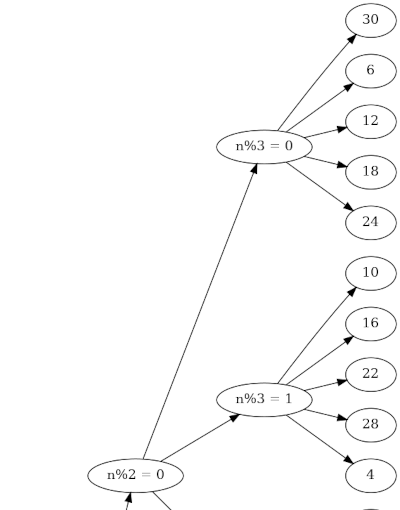
In the earlier post about the MLB tree structure, I showed how you could number baseball teams so that the team number n could tell you the league, division, and order within a division by taking the remainders when n is divided by 2, 3, and 5. Because the NBA tree structure is isomorphic, the same applies to the NBA.

Here’s a portion of the graph with numbering. The full version is available here as a PDF.

Here’s the ordering.

  1. Los Angeles Clippers
  2. Miami Heat
  3. Portland Trail Blazers
  4. Milwaukee Bucks
  5. Dallas Mavericks
  6. Brooklyn Nets
  7. Los Angeles Lakers
  8. Orlando Magic
  9. Utah Jazz
  10. Chicago Bulls
  11. Houston Rockets
  12. New York Knicks
  13. Phoenix Suns
  14. Washington Wizards
  15. Denver Nuggets
  16. Cleveland Cavaliers
  17. Memphis Grizzlies
  18. Philadelphia 76ers
  19. Sacramento Kings
  20. Atlanta Hawks
  21. Minnesota Timberwolves
  22. Detroit Pistons
  23. New Orleans Pelicans
  24. Toronto Raptors
  25. Golden State Warriors
  26. Charlotte Hornets
  27. Oklahoma City Thunder
  28. Indiana Pacers
  29. San Antonio Spurs
  30. Boston Celtics

Incidentally, the images at the top of the post were created with DALL-E. They look nice overall, but you’ll see bizarre details if you look too closely.

Numbering minor league baseball teams

El Paso Chihuahuas team logo
Last week I wrote about how to number MLB teams so that the number n told you where they are in the league hierarchy:

  • n % 2 tells you the league, American or National
  • n % 3 tells you the division: East, Central, or West
  • n % 5 is unique within a league/division combination.

Here n % m denotes n mod m, the remainder when n is divided by m.

This post will do something similar for minor league teams.

There are four minor league teams associated with each major league team. If we wanted to number them analogously, we’d need to do something a little different because we cannot specify n % 2 and n % 4 independently. We’d need an approach that is a hybrid of what we did for the NFL and MLB.

We could specify the league and the rank within the minor leagues by three bits: one bit for National or American league, and two bits for the rank:

  • 00 for A
  • 01 for High A
  • 10 for AA
  • 11 for AAA

It will be convenient later on if we make the ranks the most significant bits and the league the least significant bit.

So to place a minor league team on a list, we could write down the numbers 1 through 120, and for each n, calculate r = n % 8, d = n % 3, and k = n % 5.

The latest episode of 99% Invisible is called RoboUmp, a show about automating umpire calls. As part of the story, the show discusses the whimsical names of minor league teams and how the names allude to their location. For example, the El Paso Chihuahuas are located across the border from the Mexican state of Chihuahua and their mascot is a chihuahua dog. (The dog was named after the state.)

The El Paso Chihuahuas are the AAA team associated with the San Diego Padres, a team in the National League West, team #3 in the order listed in the MLB post. The number n for the Chihuahuas must equal 7 mod 8, 111two, the first bit for National League and the last two bits for AAA. We also require n to be 2 mod 3 because it’s in the West, and n = 3 mod 5 because the Padres are #3 in the list of National League West teams in our numbering. It works out that n = 23.

How do minor league and major league numbers relate? They have to be congruent mod 30. They have to have the same parity since they represent the same league, and must be congruent mod 3 because they have in the same division. And they must be congruent mod 5 to be in the same place in the list of associated major league teams.

So to calculate a minor league team’s number, start with the corresponding major league number, and add multiples of 30 until you get the right value mod 8.

For example, the Houston Astros are number 20 in the list from the earlier post. The Triple-A team associated with the Astros is the Sugar Land Space Cowboys. The number n for the Space Cowboys must be 6 mod 8 because 6 = 110two, and they’re a Triple-A team (11) in the American League (0). So n = 110.

The Astros’ Double-A team, the Corpus Christi Hooks, needs to have a number equal to 100two = 4 mod 8, so n = 20. The High-A team, the Asheville Tourists, are 50 and the Single-A team, the Fayetteville Woodpeckers, is 80.

You can determine what major league team is associated with a minor league team by taking the remainder by 30. For example, the Rocket City Trash Pandas has number 77, so they’re associated with the major league team with number 17, which is the Los Angeles Angels. The remainder when 77 is divided by 8 is 5 = 101two, which tells you they’re a Double-A team since the high order bits are 1 and 0.

John Conway’s mental factoring method and friends

There are tricks for determining whether a number is divisible by various primes, but many of these tricks have to be applied one at a time. You can make a procedure for testing divisibility by any prime p that is easier than having to carry out long division, but these rules are of little use if every one of them is different.

Say I make a rule for testing whether a number is divisible by 59. That’s great, if you routinely need to test divisibility by 59. Maybe you work for a company that, for some bizarre reason, ships widgets in boxes of 59 and you frequently have to test whether numbers are multiples of 59.

When you want to factor numbers, you’d like to test divisibility by a set of primes at once, using fewer separate algorithms, and taking advantage of work you’ve already done.

John Conway came up with his 150 Method to test for divisibility by a sequence of small primes. This article explains how Conway’s 150 method and a couple variations work. The core idea behind Conway’s 150 Method, his 2000 Method, and analogous methods developed by others is this:

  1. Find a range of integers, near a round number, that contains a lot of distinct prime factors.
  2. Reduce your number modulo the round number, then test for divisibility sequentially, reusing work.

Conway’s 150 Method starts by taking the quotient and remainder by 150. And you’ll never guess what his 2000 Method does. :)

This post will focus on the pattern behind Conway’s method, and similar methods. For examples and practical tips on carrying out the methods, see the paper linked above and a paper I’ll link to below.

The 150 Method

Conway exploited the fact that the numbers 152 through 156 are divisible by a lot of primes: 2, 3, 5, 7, 11, 13, 17, 19, and 31.

He starts his method with 150 rather than 152 because 150 is a round number and easier to work with. We start by taking the quotient and remainder by 150.

Say n = 150q + r. Then n − 152q = r − 2q. If n has three or four digits, q only has one or two digits, and so subtracting q is relatively easy.

Since 19 divides 152, we can test whether n is divisible by 19 by testing whether r − 2q is divisible by 19.

The next step is where sequential testing saves effort. Next we want to subtract off a multiple of 153 to test for divisibility by 17, because 17 divides 153. But we don’t have to start over. We can reuse our work from the previous step.

We want n − 153q = (n − 152q) − q, and we’ve already calculated n − 152q in the previous step, so we only need to subtract q.

The next step is to find n − 154q, and that equals (n − 153q) − q, so again we subtract q from the result of the previous step. We repeat this process, subtracting q each time, and testing for divisibility by a new set of primes each time.

The 2000 method

Conway’s more extensive method exploited the fact that the numbers 1998 through 2021 are divisible by all primes up to 67. So he would start by taking the quotient and remainder by 2000, which is really easy to do.

Say n = 2000q + r. Then we would add (or subtract) q each time.

You could start with r, then test r for divisibility by the factors of 2000, then test rq for divisibility by the factors of 2001, then test r − 2q for divisibility by the factors of 2002, and so on up to testing r − 21q for divisibility by the factors of 2021. Then you’d need to go back and test r + q for divisibility by the factors of 1999 and test r + 2q for divisibility by the factors of 1998.

In principle that’s how Conways 2000 Method works. In practice, he did something more clever.

Most of the prime factors of the numbers 1998 through 2021 are prime factors of 1998 through 2002, so it makes sense to test this smaller range first hoping for early wins. Also, there’s no need to test divisibility by the factors of 1999 because 1999 is prime.

Conway tested rkq for k = −2 through 21, but not sequentially. He would try out the values of k in an order most likely to terminate the factoring process early.

The 10,000 method

This paper gives a much more extensive approach to mental factoring than Conway’s 150 method. The authors, Hilarie Orman and Richard Schroeppel, outline a strategy for factoring any six-digit number. Conway’s rule is more modest, intended for three and four digit numbers.

Orman and Schroeppel suggest a sequence of factoring methods, including more advanced techniques to use after you’ve tried testing for divisibility by small primes. One of the techniques in the paper might be called the 10,000 Method by analogy to Conway’s method, though the authors don’t call it that. They call it “check the m‘s” for reasons that make more sense if you read the paper.

The 10,000 Method is much like the 2000 Method. The numbers 10,001 through 10,019 have a lot of prime factors, and the method tests for divisibility by these factors sequentially, taking advantage of previous work at each step, just as Conway’s methods do. The authors do not backtrack the way Conway did; they test numbers in order. However, they do skip over some numbers, like Conway skipped over 1999.

More Conway-related posts
Major League Baseball and number theory

The previous post took a mathematical look at the National Football League. This post will do the same for Major League Baseball.

Like the NFL, MLB teams are organized into a nice tree structure, though the MLB tree is a little more complicated. There are 32 NFL teams organized into a complete binary tree, with a couple levels collapsed. There are 30 MLB teams, so the tree structure has to be a bit different.

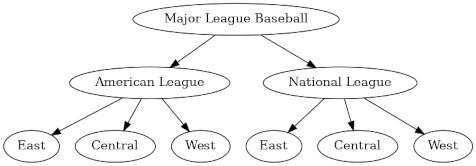
MLB has leagues rather than conferences, but the top-level division is into American and Nation as with the NFL. So the top division is into the American League and the National League.

And as with football, the next level of the hierarchy is divisions. But baseball has three divisions—East, Central, and West—in contrast to four in football.

Each division has five baseball teams, while each football division has four teams.

Here’s the basic tree structure.

Under each division are five teams. Here’s a PDF with the full graph including teams.

Geography

How do the division names correspond to actual geography?

Within each league, the Central teams are to the west of the East teams and to the east of the West teams, with one exception: in the National League, the Pittsburgh Pirates are a Central division team, but they are east of the Atlanta Braves and Miami Marlins in the East division. But essentially the East, Central, and West divisions do correspond to geographic east, center, and west, within a league.

Numbering

We can’t number baseball teams as elegantly as the previous post numbered football teams. We’d need a mixed-base number. The leading digit would be binary, the next digit base 3, and the final digit base 5.

We could number the teams so that you could tell the league and division of the team by looking at the remainders when the number is divided by 2 and 3, and each team is unique mod 5. By the Chinese Remainder Theorem, we can solve the system of congruence equations mod 30 that specify the value of a number mod 2, mod 3, and mod 5.

If we number the teams as follows, then even numbered teams are in the American League and odd numbered teams are in the National League. When the numbers are divided by 3, those with remainder 0 are in an Eastern division, those with remainder 1 are in a Central division, and those with remainder 2 are in a Western division. Teams within the same league and division have unique remainders by 5.

  1. Cincinnati Reds
  2. Oakland Athletics
  3. Philadelphia Phillies
  4. Minnesota Twins
  5. Arizona Diamondbacks
  6. Boston Red Sox
  7. Milwaukee Brewers
  8. Seattle Mariners
  9. Washington Nationals
  10. Chicago Whitesocks
  11. Colorado Rockies
  12. New York Yankees
  13. Pittsburgh Pirates
  14. Texas Rangers
  15. Atlanta Braves
  16. Cleveland Guardians
  17. Los Angeles Dodgers
  18. Tampa Bay Rays
  19. St. Louis Cardinals
  20. Houston Astros
  21. Miami Marlins
  22. Detroit Tigers
  23. San Diego Padres
  24. Toronto Blue Jays
  25. Chicago Cubs
  26. Los Angeles Angels
  27. New York Mets
  28. Kansas City Royals
  29. San Francisco Giants
  30. Baltimore Orioles

Related posts

A mathematical look at the NFL

This post will look at the National Football League through the lens of graph theory, topology, and binary numbers.

The NFL has a very nice tree structure, which isn’t too surprising in light of the need to make tournament brackets. The NFL is divided into two conferences, the American Football Conference and the National Football Conference.

Tree structure

Each conference is divided into four divisions named after geographical regions. Since this is a mathematical post, I’ve listed the regions counterclockwise starting in the east because that’s how mathematicians do things.

NFL -> AFC<br /> NFL -> NFC<br /> AFC -> AFCE<br /> AFC -> AFCN<br /> AFC -> AFCW<br /> AFC -> AFCS<br /> NFC -> NFCE<br /> NFC -> NFCN<br /> NFC -> NFCW<br /> NFC -> NFCS

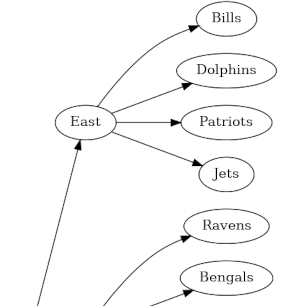
Each division has four teams. Adding each team under its division would make an awkwardly wide graph. I made a graph of the entire tree, rotated so that image is long rather than wide. Here’s a little piece of it.

The full image is available here.

Geography

Now you may wonder how well the geographic division names correspond to geography. For example, the Dallas Cowboys are in the NFC East, and it’s a little jarring to hear Texas called “east.”

But within each conference, all the “East” teams are indeed east of all the West teams. And with one exception, all the North teams are indeed north of the South teams. The Indianapolis Colts are the exception. The Colts are in the AFC South, but are located to the north of the Cincinnati Bengals and the Baltimore Ravens in the AFC North.

This geographical sorting only applies within a conference. The Dallas Cowboys, for example are east of all the West teams within their conference, but they are west of the Kansas City Chiefs in the AFC West.

Here’s where topology comes in: you can make the division names match their geography if you morph the map of the United States pulling Indianapolis south of its geometric location.

Binary numbers

The graph structure of the NFL is essentially a full binary tree; you could make it into a binary tree by introducing a sub-conference layer and grouping the teams into pairs.

You could number the NFL teams with five bits: one for the conference, two for the division, and two more for the team. We could make the leading bit 0 for the AFC and 1 for the NFC. Then within each division, we could use 00 for East, 01 for North, 10 for West, and 11 for South. As mentioned above, this follows the mathematical convention of angles increasing counterclockwise starting at the positive x-axis.

The table above is an SVG image; here is the same data in plain text.

Related posts

How Mr. Benjamin squares numbers

This post is a sequel to the post How Mr. Bidder calculated logarithms published a few days ago. As with that post, this post is based on an excerpt from The Great Mental Calculators by Steven B. Smith.

Smith’s book says Arthur Benjamin squares large numbers using the formula

n² = (n + a)(na) + a²

where a is chosen to make the multiplication easier, i.e. to make n + a or na a round number. The method is then applied recursively to compute a², and the process terminates when you get to a square you have memorized. There are nuances to using this method in practice, but that’s the core idea.

The Great Mental Calculators was written in 1983 when Benjamin was still a student. He is now a mathematics professor, working in combinatorics, and is also well known as a mathemagician.

Major system

Smith quotes Benjamin giving an example of how he would square 4273. Along the way he needs to remember 184 as an intermediate result. He says

The way I remember it is by converting 184 to the word ‘dover’ using the phonetic code.

I found this interesting because I had not heard of anyone using the Major system (“the phonetic code”) in real time. This system is commonly used to commit numbers to long-term memory, but you’d need to be very fluent in the system to encode and decode a number in the middle of a calculation.

Maybe a lot of mental calculators use the Major system, or some variation on it, during calculations. Most calculators are not as candid as Benjamin in explaining how they think.

Related posts

Bounding derivatives of the sinc function

The sinc function is defined either as sin(x)/x or as sin(πx)/πx. We’ll use the former definition here because we’ll cite a paper that uses that definition.

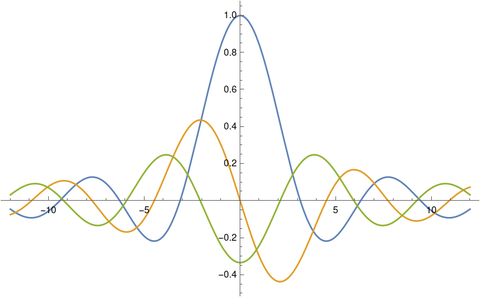
Here’s a plot of the sinc function and its first two derivatives.

Thomas Grönwall proposed a problem to the American Mathematical Monthly in 1913 [1] bounding the derivatives of the sinc function:

\left| \frac{d^n}{dx^n} \frac{\sin x}{x}\right| \leq \frac{1}{n+1}

Seven years later, Dunkel gave an elegant proof. Perhaps Grönwall had a proof and was proposing his inequality as a challenge, or maybe it was a conjecture at the time he published it. In any case, the proof by Dunkel is very nice. He sets

y = sin(x)/x

and repeatedly differentiates both sides of the equation

xy = sin(x).

See the details in Dunkel’s solution.

I don’t know of an application of Grönwall’s inequality offhand. But the sinc function is common in signal processing, and so maybe his inequality has applications there.

(By “Grönwall’s inequality” I mean the inequality above. There is another theorem also known as Grönwall’s inequality that is commonly applied in differential equations.)

[1] Gronwall, T. H. (1913). Problem 339. Amer. Math. Monthly. 20: 196.

[2] Dunkel, O., (1920). Solution to Problem 339. Amer. Math. Monthly. 27: 81–85.