Python code to solve Kepler’s equation

The previous post looked at solving Kepler’s equation using Newton’s method. The problem with using Newton’s method is that it may not converge when the eccentricity e is large unless you start very close to the solution. As discussed at the end of that post, John Machin came up with a clever way to start close. His starting point is defined as follow.

\begin{align*} n &= \sqrt{5 + \sqrt{16 + \frac{9}{e}}} \\ M &= n \left((1-e)s + \frac{e(n^2 - 1) + 1}{6}s^3 \right) \\ x_0 &= n \arcsin s \end{align*}

The variable s is implicitly defined as the root of a cubic polynomial. This could be messy. Maybe there are three real roots and we have to decide which one to use. Fortunately this isn’t the case.

The discriminant of our cubic equation is negative, so there is only one real root. And because our cubic equation for s has no s² term the expression for the root isn’t too complicated.

Here’s Python code to solve Kepler’s equation using Newton’s method with Machin’s starting point.

    from numpy import sqrt, cbrt, pi, sin, cos, arcsin, random
    
    # This will solve the special form of the cubic we need.
    def solve_cubic(a, c, d):
        assert(a > 0 and c > 0)
        p = c/a
        q = d/a
        k = sqrt( q**2/4 + p**3/27 )
        return cbrt(-q/2 - k) + cbrt(-q/2 + k)
    
    # Machin's starting point for Newton's method
    # See johndcook.com/blog/2022/11/01/kepler-newton/
    def machin(e, M):
        n = sqrt(5 + sqrt(16 + 9/e))
        a = n*(e*(n**2 - 1)+1)/6
        c = n*(1-e)
        d = -M
        s = solve_cubic(a, c, d)
        return n*arcsin(s)    
    
    def solve_kepler(e, M):
        "Find E such that M = E - e sin E."
        assert(0 <= e < 1)
        assert(0 <= M <= pi) 
        f = lambda E: E - e*sin(E) - M 
        E = machin(e, M) 
        tolerance = 1e-10 

        # Newton's method 
        while (abs(f(E)) > tolerance):
            E -= f(E)/(1 - e*cos(E))
        return E

To test this code, we’ll generate a million random values of e and M, solve for the corresponding value of E, and verify that the solution satisfies Kepler’s equation.

    random.seed(20221102)
    N = 1_000_000
    e = random.random(N)
    M = random.random(N)*pi
    for i in range(N):
        E = solve_kepler(e[i], M[i])
        k = E - e[i]*sin(E) - M[i]
        assert(abs(k) < 1e-10)
    print("Done")

All tests pass.

Machin’s starting point is very good, and could make an adequate solution on its own if e is not very large and if you don’t need a great deal of accuracy. Let’s illustrate by solving Kepler’s equation for the orbit of Mars with eccentricity e = 0.09341.

Error in Machin's starting guess as a function of M

Here the maximum error is 0.01675 radians and the average error is 0.002486 radians. The error is especially small for small values of M. When M = 1, the error is only 1.302 × 10⁻⁵ radians.

Solving Kepler’s equation with Newton’s method

Postage stamps featuring Kepler and Newton

In the introduction to his book Solving Kepler’s Equation Over Three Centuries, Peter Colwell says

In virtually every decade from 1650 to the present there have appeared papers devoted to the Kepler problem and its solution.

This is remarkable because Kepler’s equation isn’t that hard to solve. It cannot be solved in closed form using elementary functions, but it can be solved in many other ways, enough ways for Peter Colwell to write a survey about. One way to find a solution is simply to guess a solution, stick it back in, and iterate. More on that here.

Researchers keep writing about Kepler’s equation, not because it’s hard, but because it’s important. It’s so important that a slightly more efficient solution is significant. Even today with enormous computing resources at our disposal, people are still looking for more efficient solutions. Here’s one that was published last year.

Kepler’s equation

What is Kepler’s equation, and why is it so important?

Kepler’s problem is to solve

M = E - e \sin E

for E, given M and e, assuming 0 ≤ M ≤ π and 0 < e < 1.

This equation is important because it essentially tells us how to locate an object in an elliptical orbit. M is mean anomaly, e is eccentricity, and E is eccentric anomaly. Mean anomaly is essentially time. Eccentric anomaly is not exactly the position of the orbiting object, but the position can be easily derived from E. See these notes on mean anomaly and eccentric anomaly. This is because we’re using our increased computing power to track more objects, such as debris in low earth orbit or things that might impact Earth some day.

Newton’s method

A fairly obvious approach to solving Kepler’s equation is to use Newton’s method. I think Newton himself applied his eponymous method to this equation.

Newton’s method is very efficient when it works. As it starts converging, the number of correct decimal places doubles on each iteration. The problem is, however, that it may not converge. When I taught numerical analysis at Vanderbilt, I used a textbook that quoted this nursery rhyme at the beginning of the chapter on Newton’s method.

There was a little girl who had a little curl
Right in the middle of her forehead.
When she was good she was very, very good
But when she was bad she was horrid.

To this day I think of that rhyme every time I use Newton’s method. When Newton’s method is good, it is very, very good, converging quadratically. When it is bad, it can be horrid, pushing you far from the root, and pushing you further away with each iteration. Finding exactly where Newton’s method converges or diverges can be difficult, and the result can be quite complicated. Some fractals are made precisely by separating converging and diverging points.

Newton’s method solves f(x) = 0 by starting with an initial guess x0 an iteratively applies

x_{n+1} = x_n - \frac{f(x_n)}{f'(x_n)}

Notice that

A sufficient condition for Newton’s method to converge is for x0 to belong to a disk around the root where

\left| \frac{f(x)f''(x)}{f'(x)^2}\right| < 1

throughout the disk.

In our case f is the function

f(x; e, M) = x - e \sin(x) - M

where I’ve used x instead of E because Mathematica reserves E for the base of natural logarithms. To see whether the sufficient condition for convergence given above applies, let’s define

g(x; e, M) = \left| \frac{e(x - e \sin x - M) \sin x}{(1 - e\cos x)^2} \right|

Notice that the denominator goes to 0 as e approaches 1, so we should expect difficulty as e increases. That is, we expect Newton’s method might fail for objects in a highly elliptical orbit. However, we are looking at a sufficient condition, not a necessary condition. As I noted here, I used Newton’s method to solve Kepler’s equation for a highly eccentric orbit, hoping for the best, and it worked.

Starting guess

Newton’s method requires a starting guess. Suppose we start by setting E = M. How bad can that guess be? We can find out using Lagrange multipliers. We want to maximize

(E-M)^2

subject to the constraint that E and E satisfy Kepler’s equation. (We square the difference to get a differentiable objective function to maximize. Minimizing the squared difference minimizes the absolute difference.)

Lagrange’s theorem tells us

\begin{pmatrix} 2x \\ -2M\end{pmatrix} = \lambda \begin{pmatrix} 1 - e \cos x \\ -1\end{pmatrix}

and so λ = 2M and

2x = 2M(1 - e\cos x)

We can conclude that

|x - M| \leq \frac{|e \cos x|}{2} \leq \frac{e}{2} \leq \frac{1}{2}

This says that an initial guess of M is never further than a distance of 1/2 from the solution x, and its even closer when the eccentricity e is small.

If e is less than 0.55 then Newton’s method will converge. We can verify this in Mathematica with

    NMaximize[{g[x, e, M], 0 < e < 0.55, 0 <= M <= Pi, 
        Abs[M - x] < 0.5}, {x, e, M}]

which returns a maximum value of 0.93. The maximum value is an increasing function of the upper bound on e, so converting for e = 0.55 implies converging for e < 0.55. On the other hand, we get a maximum of 1.18 when we let e be as large as 0.60. This doesn’t mean Newton’s method won’t converge, but it means our sufficient condition cannot guarantee that it will converge.

A better starting point

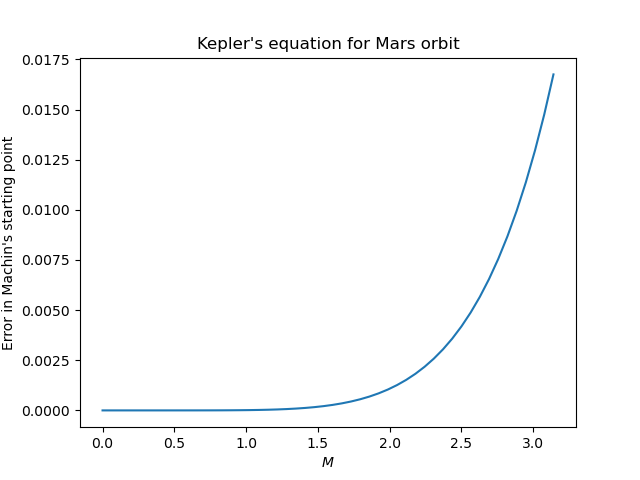
John Machin (1686–1751) came up with a very clever, though mysterious, starting point for solving Kepler’s equation with Newton’s method. Machin didn’t publish his derivation, though later someone was able to reverse engineer how Machin must have been thinking. His starting point is as follows.

\begin{align*} n &= \sqrt{5 + \sqrt{16 + \frac{9}{e}}} \\ M &= n \left((1-e)s + \frac{e(n^2 - 1) + 1}{6}s^3 \right) \\ x_0 &= n \arcsin s \end{align*}

This produces an adequate starting point for Newton’s method even for values of e very close to 1.

Notice that you have to solve a cubic equation to find s. That’s messy in general, but it works out cleanly in our case. See the next post for a Python implementation of Newton’s method starting with Machin’s starting point.

There are simpler starting points that are better than starting with M but not as good as Machin’s method. It may be more efficient to spend less time on the best starting point and more time iterating Newton’s method. On the other hand, if you don’t need much accuracy, and e is not too large, you could use Machin’s starting point as your final value and not use Newton’s method at all. If e < 0.3, as it is for every planet in our solar system, then Machin’s starting point is accurate to 4 decimal places (See Appendix C of Colwell’s book).

Numerically evaluating a theta function

Theta functions pop up throughout pure and applied mathematics. For example, they’re common in analytic number theory, and they’re solutions to the heat equation.

Theta functions are analogous in some ways to trigonometric functions, and like trigonometric functions they satisfy a lot of identities. This post will comment briefly on an identity that makes a particular theta function, θ3, easy to compute numerically. And because there are identities relating the various theta functions, a method for computing θ3 can be used to compute other theta functions.

The function θ3 is defined by

\theta_3(z, t) = 1 + \sum_{k=1}^\infty q^{k^2} \cos(2kz)

where

q = e^{\pi i t}

Here’s a plot of θ3 with t = 1 + i

produced by the following Mathematica code:

    
    q = Exp[Pi I (1 + I)]
    ComplexPlot3D[EllipticTheta[3, z, q], {z, -1, 8.5 + 4 I}]

An important theorem tells us

\theta_3(z, t) = (-it)^{-1/2} \exp(z^2/\pi i t)\, \theta_3\left(\frac{z}{t}, -\frac{1}{t} \right )

This theorem has a lot of interesting consequences, but for our purposes note that the identity has the form

\theta_3(\ldots, t) = \ldots \theta_3\left(\ldots, -\frac{1}{t} \right )

The important thing for numerical purposes is that t is on one side and 1/t is on the other.

Suppose t = a + bi with a > 0 and b > 0. Then

q = \exp\left(\pi i (a + bi)\right) = \exp(-\pi b) \exp(\pi i a)

Now if b is small, |q| is near 1, and the series defining θ3 converges slowly. But if b is large, |q| is very small, and the series converges rapidly.

So if b is large, use the left side of the theorem above to compute the right. But if b is small, use the right side to compute the left.

Related posts

Numerically finding roots of a cubic

The analog of the quadratic formula for cubic equations is cumbersome. A lot of people naturally say “Forget all that. If I need to find the roots of a cubic, I’ll just use a numerical method like Newton’s method.” Sounds good.

Where to start?

But how do you know where to look for the roots? You have to have some idea where a root is before you can use a numerical method.

For the bisection method, you have to know an interval where the polynomial changes sign. For Newton’s method, if you don’t start close enough, you diverge. In fact, you can make complex fractals by plotting the points where Newton’s method converges and diverges.

Cornelius Lanczos gives an elegant explanation of how to solve cubic equations at the beginning of his book Applied Analysis. His book was published in 1956, before the days of ubiquitous computers, and so he couldn’t say “Plot the function and scroll around until you can see roughly where the zeros are.”

Lanczos does a sequence of change of variables that reduce the problem to finding a unique root in the unit interval.

Setup

Let

f(x) = ax³ + bx² + cx + d

where the coefficients are all real numbers. We want to find all real values of x where f(x) = 0.

The main task is to find a root of f(x). Once we’ve found a root r, we can divide by (xr) to reduce the problem to a quadratic.

Reduce to standard form

By a change of variables we can reduce the problem to finding a root of

x³ + bx² + cx  − 1 = 0.

How? First of all, you can always make the leading coefficient 1 by dividing by a if necessary. Second, you can make the constant term negative by replacing x by a new variable equal to –x. Third, you can make the constant term -1 by replacing x with d−1/3x.

We’ve divided by a and d above. How do we know they’re not zero? If they were zero, that would be good news because it would make things easier.

We assume a is not zero because otherwise we don’t have a cubic equation. And we assume d is not zero because otherwise we can factor out an x and we’re left with a quadratic equation.

Bracketing a root

After our changes of variable,

f(x) = x³ + bx² + cx  – 1.

So f(0) = -1 and f(x) goes to infinity as x goes to infinity, and this means f(x) must have at least one positive root.

Evaluate f(1). If f(1) = 0 then you’re very lucky because you’ve found your root.

If f(1) > 0 then there is a root in (0, 1) since the polynomial changes signs over the interval.

If f(1) < 0 then the function has a root in (1,∞) . In that case, replace x with 1/x and then the new polynomial has a root somewhere in (0, 1).

Uniqueness

If f(x) equals zero somewhere in the interval (0, 1), could it be zero at two or three places in the interval?

It cannot have just two roots in the interval because the sign is different at the two ends of the interval.

It also cannot have three roots in the interval. We know from Vieta’s formula that the product of the roots of f equals 1. It cannot have three roots in the interval (0, 1) because the product of three positive numbers less than 1 is less than 1.

If f(x) had a zero somewhere in (1,∞) before replacing x with 1/x, an analogous argument applies. It can’t have two zeros because it changes signs over the interval, and it can’t have three zeros in the interval because if three numbers are each greater than 1, their product is greater than 1.

In either case, possibly after replacing x with 1/x, we know f has a unique root in the interval (0, 1), and now we can apply a numerical method.

More general functions

This post looked at a very special function, a cubic polynomial with real coefficients, and showed that after a change of variables it has a unique root in an interval. The next post shows how to determine how many zeros a more general, complex-valued function has in a region of the complex plane.

Related posts

Numerical footnote

Yesterday’s post said that that you could construct a chain of linear relationships between the hypergeometric function

F(a, b; c; z)

and

F(a+i, b+j; c+k; z)

for integers i, j, and k. Toward the end of the post I said that this could be used to speed up programs by computing function values from previous values rather than from scratch. This is true, but you need to check whether there are numerical issues.

You have to be careful when using recurrence relations numerically. It’s common for a recurrence to be numerically stable in one direction but unstable in the opposite direction. I wrote about this here and gave examples.

The stability problems for recurrence relations are the discrete analog of the more familiar problem of sensitive dependence on initial conditions for differential equations described here.


Quasi-Monte Carlo integration: periodic and nonperiodic

Monte Carlo integration, or “integration by darts,” is a general method for evaluating high-dimensional integrals. Unfortunately it’s slow. This motivated the search for methods that are like Monte Carlo integration but that converge faster.

Quasi-Monte Carlo (QMC) methods use low discrepancy sequences that explore a space more efficiently than random samples. These sequences are deterministic but in some ways behave like random sequences, hence the name.

On the right problem, QMC integration can be very efficient. On other problems QMC can be mediocre. This post will give an example of each.

Computing ζ(3)

The first example comes from computing the sum

\sum_{n=1}^\infty \frac{1}{n^3}

which equals ζ(3), the Riemann zeta function evaluated at 3.

A few days ago I wrote about ways to compute ζ(3). The most direct way of computing the sum is slow. There are sophisticated ways of computing the sum that are much faster.

There is an integral representation of ζ(3), and so one way to numerically compute ζ(3) would be to numerically compute an integral.

\int_0^1\!\int_0^1\!\int_0^1 \frac{1}{1 + xyz}\, dx\, dy\, dz = \dfrac{3}{4}\, \zeta(3)

Let’s see how well quasi-Monte Carlo integration works on this integral. We will use a lattice rule, evaluating our integrand at the points of a quasi-Monte Carlo sequence

\left( \{ n\sqrt{2}\}, \{ n\sqrt{3}\}, \{ n\sqrt{5}\} \right )

and averaging the results. (Lattice sequences are a special case of quasi-Monte Carlo sequences.)

The notation {x} denotes the fractional part of x. For example, {π} = 0.14159….

Here’s some Python code to compute the integral.

    import numpy as np

    def f(x): return 1/(1 + x[0]*x[1]*x[2])

    v = np.sqrt(np.array([2,3,5])) 
    def g(N): return sum( f(n*v % 1) for n in range(1,N+1) ) / N

And here’s a plot that shows how well this does as a function of N.

The results are mediocre. The averages are converging to the right value as N increases, but the accuracy isn’t great. When N = 100 the error is 0.001, larger than the error from summing 100 terms of the sum defining ζ(3).

I want to make two points about this example before moving on to the next example.

First, this doesn’t mean that evaluating ζ(3) by computing an integral is necessarily a bad idea; a more efficient integration method might compute ζ(3) fairly efficiently.

Second, this doesn’t mean that QMC is a poor integration method, only that there are better ways to compute this particular integral. QMC is used a lot in practice, especially in financial applications.

Periodic integrands

The lattice rule above works better on periodic integrands. Of course in practice a lot of integrands are not periodic. But if you have an efficient way to evaluate periodic integrands, you can do a change of variables to turn your integration problem into one involving a periodic integrand.

We’ll use the same QMC sequence as above with the integrand

f(x, y, z) = x (1 − x) sin πy

which has integral 1/3π over the unit cube. Here’s a plot of the accuracy as the number of integration points N increases.

This is much better than before. The error is 0.0007 when N = 100. As N increases, the error goes down more rapidly than with the example above. When computing ζ(3), the error is about 0.001, whether N = 100 or 1,000. In this example, when N = 1,000 the error drops to 0.00003.

This example is periodic in x, y, and z, but the periodic extension is only continuous. The extension has a cusp when x or y take on integer values, and so the derivative doesn’t exist at those points.

If we square our integrand, setting

f(x, y, z) = x² (1 − x)² sin² πy

then the periodic extension is differentiable, and the integration method converges more quickly. The exact integral over the unit cube is 1/60.

Now our approximation error is about 7.3 ×10⁻⁵ when N = 100, 7.8 ×10⁻⁶ when N = 1,000, and 9.5 ×10⁻⁸ when N = 10,000.

Lattice rules work best on smooth, periodic integrands. If the integrand is smooth but not periodic and you want to use a lattice rule for integration, you’ll get better results if you first do a change of variables to create a smooth, periodic integrand.

Related posts

Error estimates for splines with more boundary conditions

Yesterday I wrote about rates of convergence for natural cubic splines. This brief post reports similar results for more boundary conditions.

As explained in the earlier post, a cubic spline that interpolates a function f at n+1 points satisfies 4n − 2 equations in 4n variables. Two more equations are necessary to uniquely determine the interpolating cubic spline.

A natural cubic spline S over [a, b] satisfies

S”(a) = 0
S”(b) = 0.

There are other ways of coming up with two more equations. You might match first derivatives at the end points

S‘(a) = f‘(a)
S‘(b) = f‘(b)

or second derivatives

S”(a) = f”(a)
S”(b) = f”(b).

Or if f is periodic you could require first and second derivatives of the spline to match at a and b.

S‘(a) = S‘(b)
S”(a) = S”(b).

In each case, you get the same order of convergence as we reported earlier for the natural cubic spline, assuming f is 4 times continuously differentiable over [a, b]. The error goes down like O(1/n4).

Source: D. Kershaw. A Note on the Convergence of Interpolatory Cubic Splines. SIAM Journal on Numerical Analysis, Mar., 1971, Vol. 8, No. 1 pp. 67-74.

Example

When we use natural cubic splines to fit exp(x) over [0, 2π] in the earlier post, the error was fairly large. We get better results when we specify the derivatives at the two ends of the interval. Here’s what we get for 11 points:

The error is about 7 times smaller than with natural cubic splines.

And here’s what we get for 21 points:

In this case the error is about 8x smaller than with natural cubic splines.

When we go from 11 to 21 points, specifying the derivatives on each end, the error drops by about a factor of 15, close value of 16 we’d expect in the limit.

Incidentally, to specify the boundary conditions of the spline in Python we need to add an option parameter bc_type in the call to CubicSpline. Otherwise the code is the same as before. In our example

    bc_type=((1, 1), (1, np.exp(2*np.pi)))

We set bc_type equal to a pair of pairs. The first pair gives a boundary condition on the left end and the second gives a boundary condition on the right. The first argument of the inner pair in both cases is 1, because we’re specifying 1st derivatives. Use a 2 to specify 2nd derivatives. The second argument to the pair the value of the derivative: exp(0) = 1 on the left, and exp(2π) on the right.

Rate of natural cubic spline convergence

Suppose you want to approximate a function with a polynomial by interpolating it at evenly spaced points. You might reasonably expect that the more points you use, the better the approximation will be. That might be true, but it might not. As explained here, for some functions the maximum approximation error actually increases as the number of points increases. This is called the Runge phenomenon.

What about cubic splines? Instead of fitting one high-degree polynomial, you fit a different cubic polynomial on each sub-interval, with the constraint that the pieces fit together smoothly. Specifically, the spline must be twice differentiable. This means that the first and second derivatives from both sides match at the end of each interval.

Say our function f is defined over an interval [a, b] and we break the interval into n sub-intervals. This means we interpolate f at n + 1 evenly spaced points. We have 4n degrees of freedom: four polynomial coefficients over each interval. Interpolation adds 2n constraints: the value of the polynomial is specified at the ends of each sub-interval. Matching first and second derivatives at each of the n − 1 interior nodes gives 2(n − 1) constrains. This is a total of 4n − 2 equations for 4n unknowns.

We get the two more equations we need by specifying something about the derivatives at a and b. A natural cubic spline sets the second derivatives equal to zero at a and b.

So if we interpolate f at n + 1 evenly spaced points using a natural cubic spline, does the splines converge uniformly to f as we increase n? Indeed they do. Nothing like Runge phenomenon can happen. If f is four times continuously differentiable over [ab], then convergence is uniform on every compact subinterval of (ab) and the rate of convergence is O(1/n4). If the second derivative of f is zero at a and b, then the rate of convergence is O(1/n4) over the whole interval [a, b].

Source: Kendall E. Atkinson. On the Order of Convergence of Natural Cubic Spline Interpolation. SIAM Journal on Numerical Analysis, Vol. 5, No. 1 (Mar., 1968), pp. 89-101.

Update: See this post for results for other kinds of cubic splines, i.e. cubic splines with different boundary conditions.

Experiment

We will look at sin(x) and exp(x) on the interval [0, 2π]. Note that the second derivatives of former at zero at both ends of the interval, but this is not true for the latter.

We will look at the error when interpolating our functions at 11 points and 21 points (i.e. 10 sub-intervals and 20 sub-intervals) with natural cubic splines. For the sine function we expect the error to go down by about a factor of 16 everywhere. For the exponential function, we expect the error to go down by about a factor of 16 in the interior of [0, 2π]. We’ll see what happens when we zoom in on the interval [2, 4].

We’re basing our expectations on a theorem about what happens as the number of nodes n goes to infinity, and yet we’re using fairly small values of n. So we shouldn’t expect too close of an agreement with theory, but we’ll see how close our prediction gets.

Computation

The following Python code will plot the error in the interpolation by natural cubic splines.

    import numpy as np
    from scipy.interpolate import CubicSpline
    import matplotlib.pyplot as plt

    for n in [11, 21]:
        for f in [np.sin, np.exp]:
            knots = np.linspace(0, 2*np.pi, n)
            cs = CubicSpline(knots, f(knots))
            x = np.linspace(0, 2*np.pi, 200)
        
            plt.plot(x, f(x) - cs(x))
            plt.xlabel("$x$")
            plt.ylabel("Error")
            plt.title(f"Interpolating {f.__name__} at {n} points")
            plt.savefig(f"{f.__name__}_spline_error_{n}.png")
            plt.close()

Notice an interesting feature of NumPy: we call the __name__ method on sin and exp to get their names as strings to use in the plot title and in the graphic file.

Here’s what we get for the sine function.

First for 10 intervals:

interpolation error for 11 points

Then for 20 intervals:

interpolation error for 11 points

When we doubled the number of intervals, the maximum error went down by about 30x, better than the theoretical upper bound on error.

Here’s what we get for the exponential function.

First for 10 intervals:

interpolation error for 11 points

Then for 20 intervals:

interpolation error for 11 points

The error in approximating the exponential function by splines is much greater than the error in approximating the sine function. That’s because the former acts less like a polynomial than the latter. Polynomial approximation, and piecewise polynomial approximation, works better on things that behave like polynomials.

When we doubled the number of intervals, the maximum error went down by a factor of 12. We shouldn’t be surprised that the error to go down by a factor of less than 16 since the hypotheses for the theorem that gives a factor of 16 aren’t satisfied.

Here’s what we get when we zoom in on the interval [2, 4].

For 10 subintervals:

interpolation error for 11 points on subinterval

And for 20 subintervals:

interpolation error for 21 points on subinterval

The error is much smaller over the interior interval. And when we double the number of interpolation points, the error over [2, 4] goes down by about a factor of 3 just as it did for sine.

Note that in these last two plots, we’re still interpolating over the entire interval [0, 2π], but we’re looking at the error over [2, 4]. We’re zooming in on part of the error plot, not allocating our interpolation points specifically to the smaller interval.

Related posts

Monotonic interpolation

Accuracy isn’t everything. Sometimes when you’re approximating a function you care more about matching a function’s qualitative behavior than matching its numerical values.

One example is interpolating monotonic data. Say your data show that increasing input always increases output. It’s likely you want a function that interpolates your data to have the same property and that you might sacrifice some accuracy to assure monotonicity. In a visual application, you might get a distracting wiggle in what should be a smoothly bending curve. In software used to control a physical device, it could lead to unexpected behavior, or even disaster, if an increase in input led to a decrease in output, even if it was a small decrease.

Linear interpolation preserves monotonicity: if in your data increasing x leads to increasing y, the same is true of a linear interpolation to the data. But for higher-order interpolation this isn’t the case. A simple example would be the three points (-1, 1), (2, 4), and (3, 9). The unique quadratic polynomial interpolating these three points is x², which is not monotonic in any interval containing 0. We’d like to have a smoother and more accurate [1] way to interpolate data while still preserving monotonicity.

It’s unlikely that a polynomial interpolating monotone data will be monotone. I suspect that given a set of monotonic data, it’s more likely that a polynomial spline interpolant will be monotone than a polynomial interpolant because the former is more flexible. Formulating this suspicion into a conjecture that could be settled theoretically, or even tested empirically, would be a non-trivial but interesting exercise.

A cubic spline interpolating monotone data is not necessarily monotone. However, there is a way to determine derivative conditions so that a Hermite spline fitting the data will be monotone. Fritsch and Carleson published an algorithm for this in 1980.

Related posts

[1] If the function sampled by your data is smooth, then in general a smooth approximation to the function will be more accurate than a piecewise linear approximation.

A gentle introduction to QMC and discrepancy

The previous post looked at the sequence

kn mod 1

where k = log2(3). This value of k arose out of exploring perfect fifths and octaves.

We saw that the sequence above fills in the unit interval fairly well, though not exactly regularly. The first 12 elements of the sequence nearly divide the unit interval into 12 nearly equal parts. And the first 53 elements of the sequence divide the interval into 53 nearly equal parts.

There’s something interesting going on here. We could set k = 1/12 and divide the unit interval into exactly 12 equal parts. But if we did, then the same sequence couldn’t also divide the interval in 53 equal parts. Our sequence fills in the unit interval fairly uniformly, more uniformly than a random sequence, but less evenly than a sequence designed to obtain a particular spacing.

Our sequence is delicately positioned somewhere between being completely regular and being completely irregular (random). The sequence is dense in the interval, meaning that it comes arbitrarily close to any point in the interval eventually. It could not do that if it were more regular. And yet it is more regular than a random sequence in a way that we’ll now make precise.

Discrepancy

Let’s pick an interval and see how often the sequence lands in that interval and compare the results to a random sequence. For my example I chose [0.1, 0.2], but I’d get similar results with any other interval.

The horizontal axis is the length of the sequence and the vertical axis is the proportion of sequence elements that fall into the test interval.

Our sequence spends about 1/10 of its time in this interval of length 1/10. The same is true of a random sequence, eventually, and with high probability. Our sequence achieves the limiting behavior of a random sequence, but it achieves it more quickly, and it does so with certainty, not just with high probability.

Here’s another example just to show that our initial choice of interval didn’t matter. We use the interval

[π − 3, e − 2] = [0.141…, 0.718…]

and we get analogous results.

The interval has width 0.57, and our sequence spends 57% of its time in the interval.

Quasi-Monte Carlo and low discrepancy

Our sequence is an example of a Quasi-Monte Carlo (QMC) sequence. The name implies that the sequence is something like a random sequence, but better in some sense. QMC sequences are said to have low discrepancy, meaning that the difference (discrepancy) between the number of points that land in an interval and the expected number is low, lower than what you’d expect from a random (Monte Carlo) sequence.

To define discrepancy rigorously we get rid of our arbitrary choice of interval and take the supremum over all subintervals. Or we could define the star-discrepancy by taking the supremum over subintervals that must start with 0 on the left end.

Even lower discrepancy

It turns out we could do better with a different choice of k. For any irrational k the sequence

kn mod 1

has low discrepancy, i.e. lower than you’d expect from a random sequence, but the discrepancy is as small as possible when k is the golden ratio.

Application

We’ve been looking at a QMC sequence in an interval, but QMC sequences in higher dimension are defined analogously. In any volume of space, the visits the space more uniformly than a random sequence.

QMC sequences are usually applied in higher dimensions, and the primary application is numerical integration. Quasi-Monte Carlo integration is more efficient than Monte Carlo integration, though the error is harder to estimate; QMC integration often does better in practice than pessimistic theoretical bounds predict. A hybrid of QMC and MC can retain the efficiency of QMC and a some of the error estimation of MC.

See more on QMC sequences are used in numerical integration.