ASQ/ANSI Z1.4 sampling procedures

I mentioned the other day that the US military standard MIL-STD-105 for statistical sampling procedures lives on in the ASQ/ANSI standard Z1.4. The Department of Defense cancelled their own standard in 1995 in favor of adopting civilian standards, in particular ASQ/ANSI Z1.4.

There are two main differences between military standard and its replacement. First, the military standard is free and the ASNI standard costs $199. Second, the ASNI standard has better typography. Otherwise the two standards are remarkably similar.

For example, the screen shot from MIL-STD-105 that I posted the other day appears verbatim in ASQ/ASNI Z1.4, except with better typesetting. The table even has the same name: “Table II-B Single sampling plans for tightened inspection (Master table).” Since the former is public domain and the latter is copyrighted, I’ll repeat my screenshot of the former.

MIL-STD-105E Table II-B

Everything I said about the substance of the military standard applies to the ASNI standard. The two give objective, checklist-friendly statistical sampling plans and acceptance criteria. The biggest strength and biggest weakness of these plans is the lack of nuance. One could create more sophisticated statistical designs that are more powerful, but then you lose the simplicity of a more regimented approach.

A company could choose to go down both paths, using more informative statistical models for internal use and reporting results from the tests dictated by standards. For example, a company could create a statistical model that takes more information into account and use it to assess the predictive probability of passing the tests required by sampling standards.

Related links

Five points determine a conic section

This post is the first in a series looking at determining an orbit. Lambert’s theorem is often summarized by saying you can determine an orbit from two observations. This statement isn’t true without further assumptions, assumptions I plan to make explicit.

A solution to the two-body problem is an orbit given by a conic section, and the general equation of a conic section in the plane is

So conic sections have five degrees of freedom: if you know five out of the six coefficients A, B, C, D, E, and F then the equation above determines the sixth coefficient. And if you know five points on a conic section, there is an elegant way to find an equation of the conic. Given points (xi, yi) for i = 1, …, 5, the following determinant yields an equation for the conic section.

\begin{vmatrix} x^2 & xy & y^2 & x & y & 1 \\ x_1^2 & x_1 y_1 & y_1^2 & x_1 & y_1 & 1 \\ x_2^2 & x_2 y_2 & y_2^2 & x_2 & y_2 & 1 \\ x_3^2 & x_3 y_3 & y_3^2 & x_3 & y_3 & 1 \\ x_4^2 & x_4 y_4 & y_4^2 & x_4 & y_4 & 1 \\ x_5^2 & x_5 y_5 & y_5^2 & x_5 & y_5 & 1 \\ \end{vmatrix} = 0

This means that five observations are enough to determine a conic section, and since Keplerian orbits are conic sections, such an orbit can be determined by five observations. How do we get from five down to two?

Astronomical observations have more context than merely points in a plane. These observations take place over time. So we have not only the positions of objects but their positions at particular times. And we know that the motion of an object in orbit is constrained by Kepler’s laws. In short, we have more data than (x, y) pairs; we have (x, y, t) triples plus physical constraints.

We also have implicit information, and future posts in this series will make this implicit information explicit. For example, suppose you’re planning a trajectory to send a probe to Mars. The path of the probe will essentially be an orbit around the sun. You can determine this orbit by two observations: the position of Earth when the probe leaves and the position of Mars when it arrives. This orbit is not simply an ellipse passing through two points. It is an ellipse with one focus at the sun. I intend to unpack this in a future post, or series of posts, making implicit data explicit.

When I write a series of blog posts, the post don’t always come out consecutively. I expect I’ll write about other topics in between posts in this series.

Update: The next post in the series considers Gibbs’ method of determining an orbit from three observations (plus two other pieces of information). The post after that is about Lambert’s theorem.

Related posts

Sharing data without letting it go

Sharing data

Suppose two companies would like to share data, but they’d also each like to retain ownership of their own data. They’d like to enable querying as if each company had given the other all its data, without actually letting go of its data.

Maybe the two companies are competitors who want to collaborate for a particular project. Or maybe the companies each have data that they are not legally allowed to share with the other. Maybe one company is interested in buying (the data of) the other and would like to have some sort of preview of what they may be buying.

Differential privacy makes this possible, and can be useful even if privacy is not an issue. The two companies have data on inanimate widgets, not persons, and yet they have privacy-like concerns. They don’t want to hand over row-level data about their widgets, and yet they both want to be able to pose questions about the combined widget data. The situation is analogous to being concerned about the “privacy” of the widgets.

Both companies would deposit data with a trusted third party, and gain access to this data via an API that implements differential privacy. Such APIs let users pose queries but do not allow either side to request row-level data.

How is this possible? What if one party poses a query that unexpectedly turns out to be asking for row-level data? For example, maybe someone asks for the average net worth of customers in Alaska, assuming there are hundreds of such customers, but the data only contains one customer in Alaska. What was intended to be an aggregate query turns out to be a row-level query.

Differential privacy handles this sort of thing automatically. It adds an amount of random noise to each query in proportion to how sensitive the query is. If you ask for what amounts to data about an individual person (or individual widget) the system will add enough noise to the result to prevent revealing row-level information. (The system may also refuse to answer the query; this is done more often in practice than in theory.) But if you ask a question that reveals very little information about a single database row, the amount of noise added will be negligible.

The degree of collaboration can be limited up front by setting a privacy budget for each company. (Again, we may not necessarily be talking about the privacy of people. We may be looking at analogous protections on units of information about physical things, such as results of destructive testing of expensive hardware.)

Someone could estimate at the start of the collaboration how large the privacy budget would need to be to allow both companies to satisfy their objectives without being so large as to risk giving away intellectual property that the parties do not wish to exchange. This budget would be spent over the course of the project. When the parties exhaust their privacy budgets, they can discuss whether to allow each other more query budget.

This arrangement allows both parties the ability to ask questions of the combined data as if they had exchanged data. However, neither party has given up control of its data. They have given each other some level of information inferred from the combined data, but neither gives a single row of data to the other.

Related posts

Robustness of mean range

Let’s suppose we have data that comes from a distribution that is approximately normal but has a heavier right tail, specifically a gamma distribution with shape 6.

gamma(6,1) PDF

We’d like to estimate the standard deviation of the data source. If the data were normally distributed, the sample standard deviation would be the most efficient unbiased estimator. But what about this example where the data are roughly normally distributed? How well does sample standard deviation compare to the mean range? Following the convention of ANSI Z1.4 we’ll average the ranges of samples of 5.

The variance of a gamma random variable with scale 1 is equal to its shape parameter, so our data has variance 6, and so standard deviation √6. We will pretend that we don’t know this and see how well we can infer this value using random samples. We’ll compare the statistical efficiency of the mean of the ranges of k samples of 5 each and the standard deviation based on 5k samples for k = 2 and 4.

First we’ll use the following code to estimate the population standard deviation with 10 samples two ways: with sample standard deviation and with the average of the range of two samples of 5. We’ll take the absolute value of the difference between each estimate and the true value, and repeat this 1,000 times to simulate the mean absolute error.

    from scipy.stats import gamma, t
    
    def meanrange(y, k):
        scale = 0.430 # scale factor for n=5
        s = 0
        for i in range(k):
            sample = y[5*i:5*(i+1)]
            s += max(sample) - min(sample)
        return scale*s/k
    
    n = 5
    k = 2
    shape = 6
    sigma = shape**0.5
    
    stderr = 0
    mrerr = 0
    N = 1000
    for _ in range(N):
        y = gamma(shape).rvs(size=n*k)    
        std = y.std(ddof=1)
        mr = meanrange(y, k)
        stderr += abs(std-sigma)
        mrerr += abs(mr-sigma)
    print(stderr/N, mrerr/N)    

The mean absolute error was 0.532 using sample standard deviation and 0.550 using mean range.

When I changed k to 4, the mean absolute error using the sample standard deviation was 0.377. The mean absolute error using the range of 4 samples of 5 each time was 0.402.

The error in both methods was comparable, though the sample standard deviation did slightly better.

Next I repeated the experiment drawing samples from a Student t distribution with 3 degrees of freedom, a distribution with heavy tails.

PDF of a t distribution with nu = 3

When k = 2, the mean absolute errors were 0.603 and 0.574 for sample standard deviation and mean range respectively. When k = 4, the errors were 0.484 and 0.431. Again the errors are comparable, but this time the mean range was more accurate.

Related posts

Average digit sum

Suppose you write down a number and take the sum of its digits. In what base will this sum be the smallest on average?

Let’s do a couple examples comparing base 10 and base 2. The number 2022 in base 10 has digit sum 6, but its binary equivalent 11111100110 has digit sum 8, so the base 10 representation has the smaller digit sum. But if we take 1024 in base 10, the digit sum is 7, but 1024 = 210 and so the sum of its binary digits is just 1.

In [1] the author proves that for sufficiently large N, the average digit sum for all positive integers less than N is the least in base 2. Moreover, the author shows that as N goes to infinity, the average digit sum of numbers less than N written in radix r is asymptotically equal to

(r – 1) log N / 2 log r.

This is an increasing function of r and so not only does base 2 have the minimum average digit sum, the average digit sum increases with the size of the base.

Let’s see how this works out with N = 1,000,000 and r ranging from 2 to 10 using the following Mathematica code.

    Table[
        Sum[ Total[IntegerDigits[n, r]], 
            {n, 0, 1000000}] /1000000., 
        {r, 2, 10}
    ]

This returns

    {9.885, 12.336, 14.8271, 16.5625, 18.5806, 
     20.5883, 22.2383, 24.1978, 27.}

Now let’s see what values the asymptotic formula predicted.

    Table[(r - 1) Log[1000000.]/(2 Log[r]), {r, 2, 10}]

This returns

    {9.96578, 12.5754, 14.9487, 17.1681, 19.2765, 
     21.2993, 23.2535, 25.1508, 27.}

So for each r the asymptotic formula produces a good approximation to the actual result.

[1] L. E. Bush. Asymptotic Formula for the Average Sum of the Digits of Integers. The American Mathematical Monthly, Mar., 1940, Vol. 47, No. 3, pp. 154-156

Using mean range method to measure variability

The most common way to measure variability, at least for data coming from a normal distribution, is standard deviation. Another less common approach is to use mean range. Standard deviation is mathematically simple but operationally a little complicated. Mean range, on the other hand, is complicated to analyze mathematically but operationally very simple.

ASQ/ANSI Z1.9

The ASQ/ANSI Z1.9 standard, Sampling Procedures and Table for Inspection by Variables for Percent Nonconforming, gives several options for measuring variability, and one of these is the mean range method. Specifically, several samples of five items each are drawn, and the average of the ranges is the variability estimate. The ANSI Z1.9 standard grew out of, and is still very similar to, the US military standard MIL-STD-414 from 1957. The ANSI standard, last updated in 2018, is not that different from the military standard from six decades earlier.

The average mean is obviously simple to carry out: take five samples, subtract the smallest value from the largest, and write that down. Repeat this a few times and average the numbers you wrote down. No squares, no square roots, easy to carry out manually. This was obviously a benefit in 1957, but not as much now that computers are ubiquitous. The more important advantage today is that the mean range can be more robust for heavy-tailed data. More on that here.

Probability distribution

The distribution of the range of a sample is not simple to write down, even when the samples come from a normal distribution. There are nice asymptotic formulas for the range as the number of samples goes to infinity, but five is a bit far from infinity [1].

This is a problem that was thoroughly studied decades ago. The random variable obtained by averaging k ranges from samples of n elements each is denoted

\overline{W}_{n,k}

or sometimes without the subscripts.

Approximate distribution

There are several useful approximations for the distribution of this statistic. Pearson [2] evaluated several proposed approximations and found that the best one for n < 10 (as it is in our case, with n = 5) to be

\frac{\overline{W}}{\sigma} \approx \frac{c \chi_\nu}{\sqrt{\nu}}

Here σ is the standard deviation of the population being sampled, and the values of c and ν vary with n and k. For example, when n = 5 and k = 4, the value of ν is 14.7 and the value of c is 2.37. The value of c doesn’t change much as k gets larger, though the value of ν does [3].

Note that the approximating distribution is chi, not the more familiar chi square. (I won’t forget a bug I had to chase down years ago that was the result of seeing χ in a paper and reading it as χ². Double, triple, quadruple check, everything looks right. Oh wait …)

For particular values of n and k you could use the approximate distribution to find how to scale mean range to a comparable standard deviation, and to assess the relative efficiency of the two methods of measuring variation. The ANSI/ASQ Z1.9 standard gives tables for acceptance based on mean range, but doesn’t go into statistical details.

Related posts

[1] Of course every finite number is far from infinity. But the behavior at some numbers is quite close to the behavior at infinity. Asymptotic estimates are not just an academic exercise. They can give very useful approximations for finite inputs—that’s why people study them—sometimes even for inputs as small as five.

[2] E. S. Pearson (1952) Comparison of two approximations to the distribution of the range in small samples from normal populations. Biometrika 39, 130–6.

[3] H. A. David (1970). Order Statistics. John Wiley and Sons.

Elliptical orbit example: Mars Orbiter Mission

This post will look at India’s first interplanetary mission, Mars Orbiter Mission, to illustrate points in recent posts.

Mars Orbiter Mission insignia

As suggested by the logo, the probe had a very eccentric orbit of Mars with periareion 3,812 km and apoareion 80,384 km. We can derive everything else from these numbers. [1]

Peri-what?! As mentioned in footnote 2 of this post the nearest and furthest points of a satellite’s orbit go by various names depending on what the satellite is orbiting. The terms perigee and apogee for Earth satellites are more familiar; the terms periareion and apoareion are the Martian counterparts. The names for the closest and furthest approaches of satellites of Jupiter would be perijove and apojove. The “areion” suffix refers to Ares, the Greek name for Mars.

So the Mars Orbiter Mission (MOM) was much closer to Mars on its nearest approach than on the opposite side of its orbit, 21 times closer. That means its tangential velocity was 21 times faster at periareion than at apoareion [2].

The orbit was an ellipse with major axis 3,812 km + 80,384 km = 84,196 km. The semi-major axis was a = 42,098 km. The center of Mars was a distance c = a – 3,812 km = 38,286 km from the center. The eccentricity was thus e = c/a = 0.909.

Using the equations from this post we find that the aspect ratio of the ellipse was 0.4158.

Orbit of Mars Orbiter Mission

Although the deviation of the orbit from circular is substantial, the distance of Mars from the center of the orbit is dramatic. More on this here.

Using the formulas from this post we can plot the mean anomaly, true anomaly, and eccentric anomaly for MOM.

True anomaly and eccentric anomaly of Mars Orbiter Mission

The steep lines on the far left and far right show how quickly the probe is moving at nearest approach to the planet. The true anomaly is the angle to the satellite based at Mars, and this angle changes very rapidly when the probe is near the planet. Eccentric anomaly is measured from the center of the orbit and so it does not change as quickly.

The period along with either the true anomaly or eccentric anomaly is enough to know the position of the satellite at all times. We can determine the period of a satellite from Kepler’s laws:

T = 2π √(a³/μ)

where μ = GM, with G being the gravitational constant and M being the mass of Mars. Now G = 6.674 × 10⁻¹¹ N m²/kg² and M = 6.417 × 10²³ kg. We’ll need to multiply a by 1,000 to work in units of meters. This gives us a period of 262,242 seconds or about 73 hours.

***

[1] My understanding is that while perigee and apogee are measured as altitude from the Earth’s surface, peri[planet] and apo[planet] are conventionally measured from the center of the planet for other planets. That’s how I’m using the terms here. When I first wrote this post, I used a value of periapeion from Wikipedia which was less than the radius of Mars and hence impossible. In retrospect the Wikipedia article was reporting an altitude.

[2] For objects in elliptical orbits, vperi / vapo = rapo / rperi. This follows from Kepler’s law that the vector from a planet to its satellite sweeps out equal area in equal time.

Military Standard 105

Military Standard 105 (MIL-STD-105) is the grand daddy of sampling acceptance standards. The standard grew out of work done at Bell Labs in the 1930s and was first published during WWII. There were five updates to the standard, the last edition being MIL-STD-105E, published in 1989.

In 1995 the standard was officially cancelled when the military decided to go with civilian quality standards moving forward. Military Standard 105 lives on through its progeny, such as ANSI/ASQ Z1.4, ASTM E2234, and ISO 2859-1. There’s been an interesting interaction between civilian and military standards: Civilian organizations adopted military standards, then the military adopted civilian standards (which evolved from military standards).

From a statistical perspective, it seems a little odd that sampling procedures are given without as much context as an experiment designed from scratch might have. But obviously a large organization, certainly an army, must have standardized procedures. A procurement department cannot review thousands of boutique experiment designs the way a cancer center reviews sui generis clinical trial designs. They have to have objective procedures that do not require a statistician to evaluate.

MIL-STD-105E Table II-B

Of course manufacturers need objective standards too. The benefits of standardization outweigh the potential benefits of customization: economic efficiency trumps the increase in statistical efficiency that might be obtained from a custom sampling approach.

Although the guidelines in MIL-STD-105 are objective, they’re also flexible. For example, instead of dictating a single set of testing procedures, the standard gives normal, tightened, and reduced procedures. The level of testing can go up or down based on experience. During normal inspection, if two out of five consecutive lots have been rejected, then testing switches to tightened procedures. Then after five consecutive lots have been accepted, normal testing can resume. And if certain conditions are met under normal procedures, the manufacturer can relax to reduced procedures [1]. The procedures are adaptive, but there are explicit rules for doing the adapting.

This is very similar to my experience with adaptive clinical trial designs. Researchers often think that “adaptive” means flying by the seat of your pants, making subjective decisions as a trial progresses. But an adaptive statistical design is still a statistical design. The conduct of the experiment may change over time, but only according to objective statistical criteria set out in advance.

MIL-STD-105 grew out of the work of smart people, such as Harold Dodge at Bell Labs, thinking carefully about the consequences of the procedures. Although the procedures have all the statistical lingo stripped away—do this thing this many times, rather than looking at χ² values—statistical thought went into creating these procedures.

MIL-STD-105E Table X Q

Related links

[1] This isn’t the most statistically powerful approach because it throws away information. It only considers whether batches met an acceptance standard; it doesn’t use the data on how many units passed or failed. The units in one batch are not interchangeable with units in another batch, but neither are they unrelated. A more sophisticated approach might use a hierarchical model that captured units within batches. But as stated earlier, you can’t have someone in procurement review hierarchical statistical analyses; you need simple rules.

Mean anomaly, true anomaly, and eccentric anomaly

Orbital mechanics has a lot of arcane terminology because it has been studied for centuries. V. I. Arnold said that orbital mechanics was one of the three main sources of modern mathematics.

Mean anomaly, true anomaly, and eccentric anomaly are three ways of describing where an object is in its orbit. All would be the same if planets moved in circular orbits. And since planets nearly do move in circular orbits [1], at least in our solar system, these three anomalies will be similar. We will demonstrate this with plots.

Mean anomaly

Suppose a planet orbiting a star has period T, i.e. it takes time T for the planet to complete one orbit. Let t0 be the time when the planet was closest to the star, i.e. the time since the planet passed through periapsis [2]. Let t be the current time. Then the mean anomaly M is simply

M = 2π(tt0) / T

if you’re working in radians. Change 2π to 360° if you’re working in degrees.

True anomaly

The true anomaly f is the angle with vertex at the star and sides running from the star to periapsis and from the star to the planet. (I don’t know why true anomaly is denoted f. I suppose t and T were taken.)

Eccentric anomaly

The eccentric anomaly E is sorta like the true anomaly, but with the vertex at the center of the elliptical orbit rather than at the star. I say sorta because that’s not quite right.

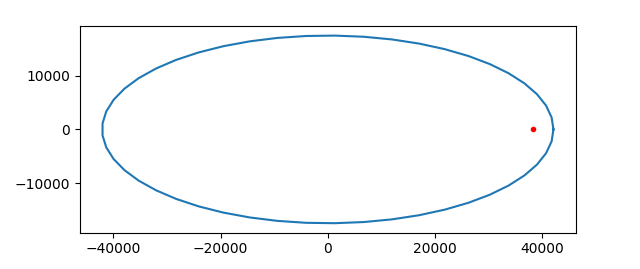
The eccentric anomaly is an angle with vertex at the center of the elliptical orbit. (The star is not at the center because elliptical orbits are eccentric, literally off-center.) One side does run along the major axis as with the true anomaly, but the other side doesn’t extend from the center to the planet but rather from the center to a projection of the planet’s orbit onto a circle.

Imagine an elliptical orbit in the plane, centered at the origin, with major axis along the x-axis. Now draw a circle around the ellipse with radius equal to the semi-major axis of the ellipse. So the circle touches the ellipse on the two ends, apsis and periapsis, but otherwise extends above and below the ellipse. Take a point P in the orbit and push it out vertically to a point P‘ on the circumscribed circle. That is, keep the x coordinate of P the same, but push the y coordinate up if it’s positive, or down if it’s negative, to get a point on the circle.

Equations

Kepler’s equation relates mean anomaly and eccentric anomaly:

M = Ee sin E

where M is the mean anomaly, E is the eccentric anomaly, and e is the eccentricity of the orbit. So when e is small, M is approximately equal to E.

True anomaly f is related to eccentric anomaly by

f = E + 2 arctan( β sin E / (1 − β cos E) )

where

β = e / (1 + √(1 − e²)).

I’ve written about Kepler’s equation a couple times. Here is a post about a simple way to solve Kepler’s equation for E given M, and here is a post about more efficient ways to solve Kepler’s equation.

Examples

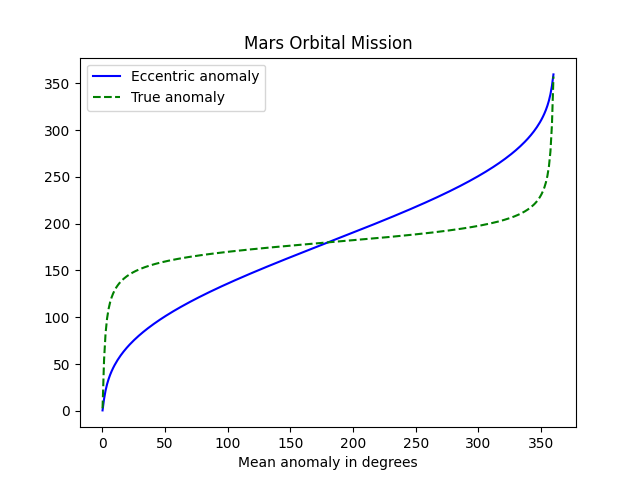
Let’s make some plots comparing mean anomaly, eccentric anomaly, and true anomaly. Mean anomaly is proportional to time, so we’ll use it as our independent variable. Eccentric anomaly and true anomaly are roughly equal to mean anomaly, so we’ll plot the difference between these anomaly and mean anomaly.

Here’s what we get for Earth, e = 0.01671.

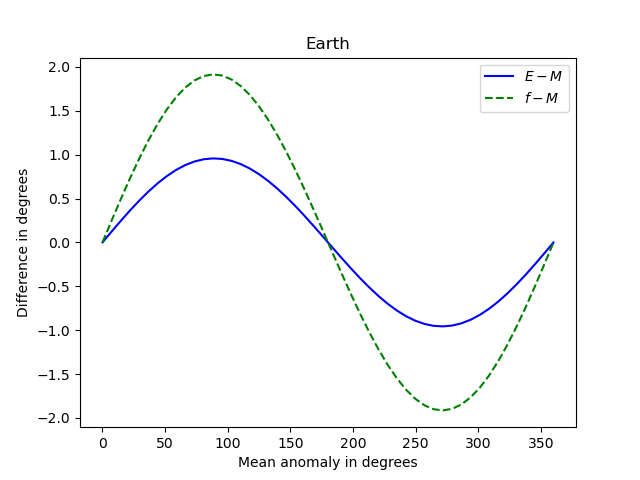
Note that the three anomalies never differ by more than 2 degrees.

And here’s what we get for Pluto, e = 0.25.

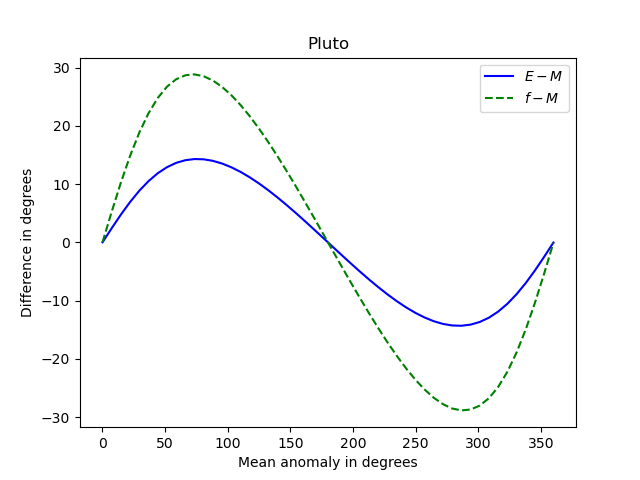
Now the differences between the anomalies is about 15 times greater. The shapes of the curves are roughly the same, but the curves for Earth are more symmetric about their peak and their trough than the corresponding curves for Pluto.

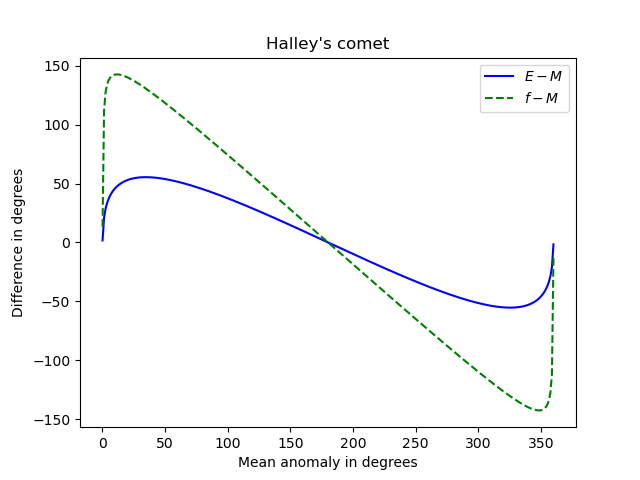
And here’s an extreme example: Halley’s comet. Its orbit has very high eccentricity, e = 0.967.

Newton’s method

I used Newton’s method to solve Kepler’s equation when making the plots above, using the mean anomaly as the initial guess when solving for the eccentric anomaly. I thought I might run into problems with high eccentricity, but everything worked smoothly, even for Halley’s comet. I suppose the basin of attraction for Newton’s method applied to Kepler’s equation is large, at least large enough to include mean anomaly as a starting point.

I didn’t even supply the root-finding method with a derivative functon. I used scipy.optimize.newton with just the function and starting point as arguments, letting the routine construct its own approximate derivative.

Notes

[1] The planets in our solar system move in very nearly circular orbits as explained here. The dwarf planet Pluto has a rather eccentric orbit (e = 0.25) and yet its orbit isn’t far from circular. However, the center of its orbit is far from the sun, as explained here.

[2] This point goes by many names in different contexts. The generic term for this point is called periapsis. For a satellite orbiting the earth it’s called perigee. For an object orbiting our sun it’s called perihelion. For an object orbiting our moon it’s called perilune. …

Cryptography, hydrodynamics, and celestial mechanics

V. I. Arnold

Last night I was reading a paper by the late Russian mathematician V. I. Arnold “Polymathematics: is mathematics a single science or a set of arts?” and posted a lightly edited extract of it on Twitter. It begins

All mathematics is divided into three parts: cryptography, hydrodynamics, and celestial mechanics.

Arnold is alluding to the opening line to Julius Caesar’s Gallic Wars [1] which suggests he’s being a little playful. The unedited version leaves no doubt that he’s being playful or cynical.

All mathematics is divided into three parts: cryptography (paid for by CIA, KGB and the like), hydrodynamics (supported by manufacturers of atomic submarines), and celestial mechanics (financed by military and other institutions dealing with missiles, such as NASA).

I edited out the parenthetical remarks, in part edit the sentence down to a tweet, but also because when you take out the humor/cynicism he makes a valid if hyperbolic point. He goes on to back this up.

Cryptography has generated number theory, algebraic geometry over finite fields, algebra, combinatorics and computers.

Hydrodynamics has procreated complex analysis, partial differential equations, Lie groups and algebra theory, cohomology theory and scientific computing.

Celestial mechanics is the origin of dynamical systems, linear algebra, topology, variational calculus and symplectic geometry.

Arnold adds a footnote to the comment about cryptography:

The creator of modern algebra, Viète, was the cryptographer of King Henry IV of France.

Of course not all mathematics was motivated by cryptography, hydrodynamics, and celestial mechanics, but an awful lot of it was. And his implicit argument that applied math gives birth to pure math is historically correct. Sometimes pure math gives rise to applied math, but much more often it’s the other way around.

His statements roughly match my own experience. Much of the algebra and number theory that I’ve learned has been motivated by cryptography. I dove into Knuth’s magnum opus, volume 2, because I wanted to implement the RSA algorithm in C++.

I got started in scientific computing in a computational fluid dynamics (CDF) lab. I didn’t work in the lab, but my roommate did, and I went there to use the computers. That’s where I would try my hand at numerical analysis and where I wrote simulation code for my dissertation. My dissertation in partial differential equations was related (very abstractly) to fluid flow in porous media.

I didn’t know anything about celestial mechanics until I sat in on Richard Arenstorf‘s class as a postdoc. So celestial mechanics was not my personal introduction to dynamical systems etc., but Arnold is correct that these fields came out of celestial mechanics.

Related posts

[1] “Gallia est omnis divisa in partes tres.” which translates “Gaul is a whole divided into three parts.”