Curious numbers

A an n-digit number is said to be curious if the last n digits of its square are the same as the original number. For example, 252 = 625 and 762 = 5776. (Curious numbers are also known as automorphic numbers.)

There are bigger curious numbers, such as 212890625 and 787109376:

2128906252 = 45322418212890625

and

7871093762 = 619541169787109376.

And if the square of x has the same last n digits as x, so does the cube of x and all higher powers.

It turns out that for each n > 1, there are two curious numbers of length n.

Always two there are; no more, no less. — Yoda

There’s even a formula for the two solutions. The first is the remainder when 5 to the power 2n is divided by 10n and the second is 10n + 1 minus the first.

Here’s a little Python code to show that the first several solutions really are solutions.

for i in range(2, 20):
    a = 5**(2**i) % 10**i
    b = 10**i - a + 1
    print((a**2 - a)%10**i, (b**2 - b)%10**i)

Related: Applied number theory

Types of nonlinearity in PDEs

My advisor in grad school used to say

“Nonlinear” is not a hypothesis but the lack of a hypothesis.

To say something positive about nonlinear equations, you have to replace linearity with some specific property. You want to partially remove the restriction of linearity without letting just anything in.

In partial differential equations, one pattern of nonlinearity is to replace linear with monotone.

We say a function on the real line is monotone if x ≥ y implies f(x) ≥ f(y). Strictly speaking this is the definition of monotone non-decreasing, but in this context the “non-decreasing” qualifier is dropped. Now suppose f is a linear transformation on Rn. What could it mean for f to be monotone when statements like x > y don’t make sense? We could rewrite the one dimensional definition as saying

(f(x) − f(y))(xy) ≥ 0

for all x and y. This form generalizes to linear transformations if we interpret the multiplication above as inner product. More generally we say that an operator A from a Banach space V to its dual V* is monotone if

(A(x) − A(y))(xy) ≥ 0

where now instead of an inner product we have more generally the action of the linear functional A(x) − A(y) on the vector xy. If the space V is a Hilbert space, then this is just an inner product, but in general it doesn’t have to be.

In applications to PDEs, the operator A would represent an operator between function spaces so that the PDE has the form Auf where u is a solution in V and the right hand side f is in V*. The operator A represents some weak form of the PDE and the space V is some sort of Sobolev space with the necessary boundary value assumptions baked in.

Monotonicity alone isn’t enough to prove existence or uniqueness. We need a few other properties.

We say the operator A from V to V* is coercive if Au(u) / ||u|| goes to infinity as ||u|| goes to infinity.

We say A is Type M if whenever un converges weakly to u, Aun converges weakly to f, and the lim sup of Aunf(u) all apply, then Au = f.

Here’s an example of the kind of theorems you can prove with these definitions.

If A is Type M, bounded, and coercive on a separable reflexive Banach space V to its dual V*, then A is surjective.

In application, the Banach space in the theorem is some sort of Sobolev space, functions in some Lp space whose generalized derivatives are in the same space, along with some boundary conditions. (You might wonder how boundary conditions can be defined for functions in such a space. They can’t directly, but they can indirectly via trace operators. Generalized boundary values for generalized functions. It’s all very generalized!)

Saying that A is surjective means the equation Au = f has a solution for any f in V*. So we reduce the problem of showing that the equation has a solution to verifying that A is Type M, bounded, and coercive. Type M is a form of continuity; bounded and coercive follow from a priori estimates.

More PDE posts

Bayesian and nonlinear

Someone said years ago that you’ll know Bayesian statistics has become mainstream when people no longer put “Bayesian” in the titles of their papers. That day has come. While the Bayesian approach is still the preferred approach of a minority of statisticians, it’s no longer a novelty. If you want people to find your paper interesting, the substance needs to be interesting. A Bayesian approach isn’t remarkable alone.

You could say the same about nonlinear differential equations. Differential equations are so often nonlinear that the “nonlinear” qualifier isn’t always necessary to say explicitly. Just as a Bayesian analysis isn’t interesting just because it’s Bayesian, a differential equation isn’t necessarily interesting just because it’s nonlinear.

The analogy between Bayesian statistics and nonlinear differential equations breaks down though. Nonlinear equations are intrinsically more interesting than linear ones. But it’s no longer remarkable to solve a nonlinear differential equation numerically.

When an adjective becomes the default, it drops off and the previous default now requires an adjective. Terms like “electronic” and “digital” are fading from use. If you say you’re going to mail someone something, the default assumption is usually that you are going to email it. What used to be simply “mail” is now “snail mail.” Digital signal processing is starting to sound quaint. The abbreviation DSP is still in common use, but digital signal processing is simply signal processing. Now non-digital signal processing requires a qualifier, i.e. analog.

There was no term for Frequentist statistics when it was utterly dominant. Now of course there is. (Some people use the term “classical,” but that’s an odd term given that Bayesian analysis is older.) The term linear has been around a long time. Even when nearly all analysis was linear, people were aware that linearity was a necessary simplification.

More on nonlinearity and Bayes

Improving on Chebyshev’s inequality

Chebyshev’s inequality says that the probability of a random variable being more than k standard deviations away from its mean is less than 1/k2. In symbols,

P(|X - E(X)| \geq k\sigma) \leq \frac{1}{k^2}

This inequality is very general, but also very weak. It assumes very little about the random variable X but it also gives a loose bound. If we assume slightly more, namely that X has a unimodal distribution, then we have a tighter bound, the Vysochanskiĭ-Petunin inequality.

P(|X - E(X)| \geq k\sigma) \leq \frac{4}{9k^2}

However, the Vysochanskiĭ-Petunin inequality does require that k be larger than √(8/3). In exchange for the assumption of unimodality and the restriction on k we get to reduce our upper bound by more than half.

While tighter than Chebyshev’s inequality, the stronger inequality is still very general. We can usually do much better if we can say more about the distribution family. For example, suppose X has a uniform distribution. What is the probability that X is more than two standard deviations from its mean? Zero, because two standard deviations puts you outside the interval the uniform is defined on!

Among familiar distributions, when is the Vysochanskiĭ-Petunin inequality most accurate? That depends, of course, on what distributions you consider familiar, and what value of k you use. Let’s look at normal, exponential, and Pareto. These were chosen because they have thin, medium, and thick tails. We’ll also throw in the double exponential, because it has the same tail thickness as exponential but is symmetric. We’ll let k be 2 and 3.

Distribution family P(|X – E(X)| > 2σ) V-P estimate P(|X – E(X)| > 3σ) V-P estimate
Uniform 0.0000 0.1111 0.0000 0.0494
Normal 0.0455 0.1111 0.0027 0.0494
Exponential 0.0498 0.1111 0.0183 0.0494
Pareto 0.0277 0.1111 0.0156 0.0494
Double exponential 0.0591 0.1111 0.0144 0.0494

A normal random variable is more than 2 standard deviations away from its mean with probability 0.0455, compared to the Vysochanskiĭ-Petunin bound of 1/9 = 0.1111. A normal random variable is more than 3 standard deviations away from its mean with probability 0.0027, compared to the bound of 4/81 = 0.0484.

An exponential random variable with mean μ also has standard deviation μ, so the only way it could be more than 2μ from its mean is to be 3μ from 0. So an exponential is more that 2 standard deviations from its mean with probability exp(−3) = 0.0498, and more than 3 standard deviations with probability exp(−4) = 0.0183.

We’ll set the minimum value of our Pareto random variable to be 1. As with the exponential, the Pareto cannot be 2 standard deviations less than its mean, so we look at the probability of it being more than 2 greater than its mean. The shape parameter α must be bigger than 2 for the variance to exist. The probability of our random variable being more than k standard deviations away from its mean works out to ((α − 1)/((k − 1)α))α and is largest as α converges down toward 2. The limiting values for k equal to 2 and 3 are 1/36 = 0.0277 and 1/64 = 0.0156 respectively. Of our examples, the Pareto distribution comes closest to the Vysochanskiĭ-Petunin bounds, but doesn’t come that close.

The double exponential, also known as Laplace, has the highest probability of any of our examples of being two standard deviations from its mean, but this probability is still less than half of the Vysochanskiĭ-Petunin bound. The limit of the Pareto distribution has the highest probability of being three standard deviations from its mean, but still less than one-third of the Vysochanskiĭ-Petunin bound.

Generic bounds are useful, especially in theoretical calculations, but it’s usually possible to do much better with specific distributions.

More inequality posts

Maximum principles and bounds for initial value problems

The previous post looked at using maximum principles to bound the solution to a boundary value problem. This is a similar post, focusing on an initial value problem. As before we start with the differential operator

L[u] = u” + g(x)u’ + h(x)

where g and h are bounded and h is non-positive. We are interested in solutions to the equation L[u] = f, but this time we want to specify the initial conditions u(0) = u0 and u(0) = u0. We will use the same maximum principle as before, but a slightly different approach to constructing upper and lower bounds on solutions. Our conclusion will also be a little different: this time we’ll get upper and lower bounds not only on the solution u but also on its derivative u‘.

We look for a function z(x) satisfying the differential inequality

L[u] ≥ f

and the two initial inequalities z(0) ≥ u0 and z(0) ≥ u0. We also look for a function w(x) satisfying the same inequalities in the opposite direction, i.e. replacing ≥ with ≤. (Note that replacing equality with inequality in the differential equation and initial conditions makes it much easier to find solutions.)

The maximum principle tells us that z and w provide upper and lower bounds respectively on u, and their derivatives provide bounds on the derivative of u. That is,

w(x) ≤ u(x) ≤ z(x)

and

w‘(x) ≤ u‘(x) ≤ z‘(x).

We illustrate this technique on a variation on Bessel’s equation:

u”(x) + u‘(x)/xu(x) = 0

with initial conditions u(0) = 1 and u‘(0) = 0. We wish to bound the solution u on the interval [0, 1].

As candidates, we try zc1x2 + 1 and wc2x2 + 1. (Why not a general quadratic polynomial? The initial conditions tell us that the linear coefficient will be 0 and the constant term will be 1.)

Since

L[cx2 + 1] = c(4 − x2) − 1

it suffices to pick c1 = 1/3 and c2 = 1/4. This tells us that

x/4 + 1 ≤ u(x) ≤ x/3 + 1.

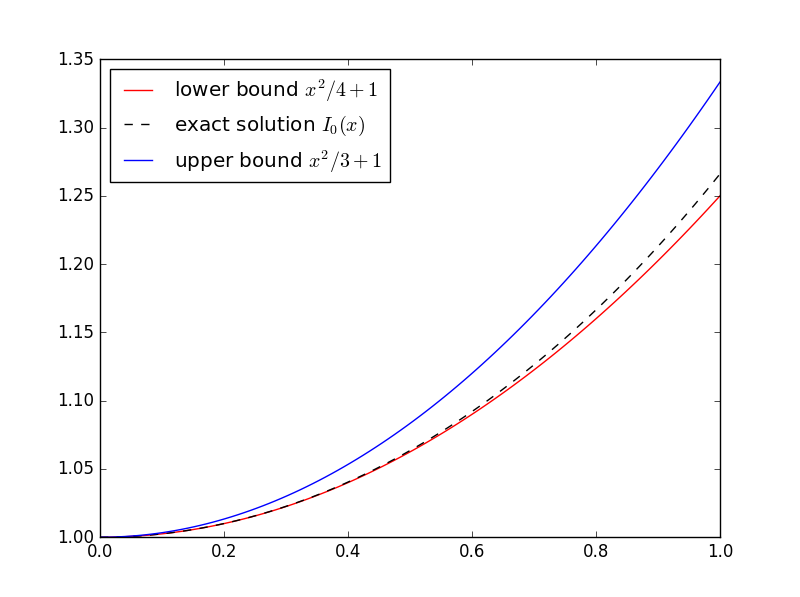
To see how well these bounds work, we compare with the exact solution I0, the so-called modified Bessel function of the first kind.

The lower bound is very good, though a comparably good upper bound would take a more careful choice of z.

Source: Maximum Principles in Differential Equations by Protter and Weinberger

More differential equations posts

Maximum principle and approximating boundary value problems

Solutions to differential equations often satisfy some sort of maximum principle, which can in turn be used to construct upper and lower bounds on solutions.

We illustrate this in one dimension, using a boundary value problem for an ordinary differential equation (ODE).

Maximum principles

If the second derivative of a function is positive over an open interval (ab), the function cannot have a maximum in that interval. If the function has a maximum over the closed interval [ab] then it must occur at one of the ends, at a or b.

This can be generalized, for example, to the following maximum principle. Let L be the differential operator

L[u] = u” + g(x)u’ + h(x)

where g and h are bounded functions on some interval [a, b] and h is non-positive. Suppose L[u] ≥ 0 on (a, b). If u has an interior maximum, then u must be constant.

Boundary value problems

Now suppose that we’re interested in the boundary value problem L[u] = f where we specify the values of u at the endpoints a and b, i.e. u(a) = ua and u(b) = ub. We can construct an upper bound on u as follows.

Suppose we find a function z such that L[z] ≤ f and z(a) ≥ ua and z(b) ≥ ub. Then by applying the maximum principle to uz, we see that uz must be ≤ 0, and so z is an upper bound for u.

Similarly, suppose we find a function w such that L[w] ≥ f and w(a) ≤ ua and w(b) ≤ ub. Then by applying the maximum principle to wu, we see that w v u must be ≤ 0, and so w is an lower bound for u.

Note that any functions z and w that satisfy the above requirements give upper and lower bounds, though the bounds may not be very useful. By being clever in our choice of z and w we may be able to get tighter bounds. We might start by choosing polynomials, exponentials, etc. Any functions that are easy to work with and see how good the resulting bounds are.

Tomorrow’s post is similar to this one but looks at bounds for an initial value problem rather than a boundary value problem.

Airy equation example

The following is an elaboration on an example from [1]. Suppose we want to bound solutions to

u”(x) − x u(x) = 0

where u(0) = 0 and u(1) = 1. (This is a well-known equation, but for purposes of illustration we’ll pretend at first that we know nothing about its solutions.)

For our upper bound, we can simply use z(x) = x. We have L[z] ≤ 0 and z satisfies the boundary conditions exactly.

For our lower bound, we use w(x) = x − βx(1 − x). Why? The function z already satisfies the boundary condition. If we add some multiple of x(1 − x) we’ll maintain the boundary condition since x(1 − x) is zero at 0 and 1. The coefficient β gives us some room to maneuver. Turns out L[w] ≥ 0 if β ≥ 1/2. If we choose β = 1/2 we have

(xx2)/2 ≤ u(x) ≤ x

In general, you don’t know the function you’re trying to bound. That’s when bounds are most useful. But this is a sort of toy example because we do know the solution. The equation in this example is well known and is called Airy’s equation. The Airy functions Ai and Bi are independent solutions. Here’s a plot of the solution with its upper and lower bounds.
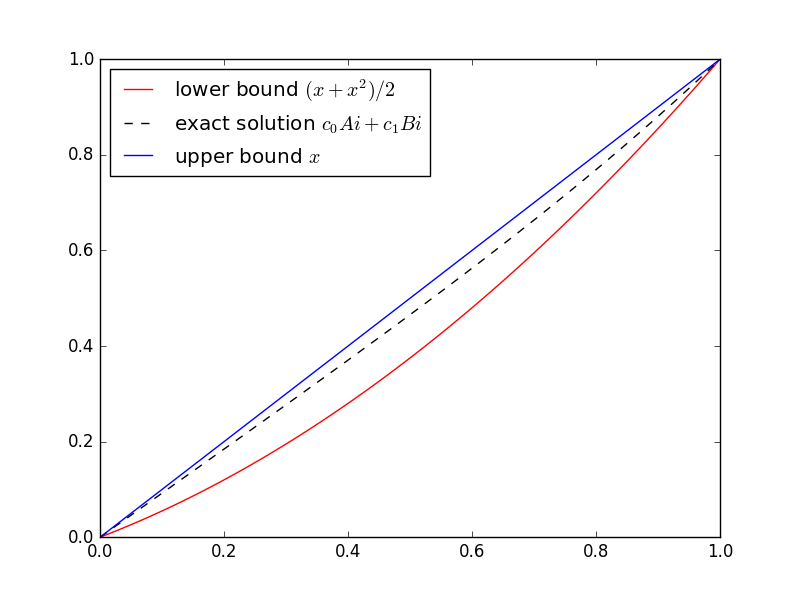
Here’s the Python code I used to solve for the coefficients of Ai and Bi and make the plot.

import numpy as np
from scipy.linalg import solve
from scipy.special import airy
import matplotlib.pyplot as plt

# airy(x) returns (Ai(x), Ai'(x), Bi(x), Bi'(x))
def Ai(x):
    return airy(x)[0]

def Bi(x):
    return airy(x)[2]

M = np.matrix([[Ai(0), Bi(0)], [Ai(1), Bi(1)]])
c = solve(M, [0, 1])

t = np.linspace(0, 1, 100)
plt.plot(t, (t + t**2)/2, 'r-', t, c[0]*Ai(t) + c[1]*Bi(t), 'k--', t, t, 'b-',)
plt.legend(["lower bound $(x + x^2)/2$", 
    "exact solution $c_0Ai + c_1Bi$", 
    "upper bound $x$"], loc="upper left")
plt.show()

SciPy’s function airy has an optimization that we waste here. The function computes Ai and Bi and their first derivatives all at the same time. We could take advantage of that to remove some redundant computations, but that would make the code harder to read. We chose instead to wait an extra nanosecond for the plot.

Help with differential equations

* * *

[1] Murray Protter and Hans Weinberger. Maximum Principles in Differential Equations.

Musical pitch notation

How can you convert the frequency of a sound to musical notation? I wrote in an earlier post how to calculate how many half steps a frequency is above or below middle C, but it would be useful go further have code to output musical pitch notation.

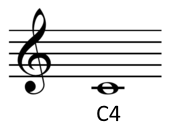
In scientific pitch notation, the C near the threshold of hearing, around 16 Hz, is called C0. The C an octave higher is C1, the next C2, etc. Octaves begin with C; other notes use the octave number of the closest C below.

C4, middle C

The lowest note on a piano is A0, a major sixth up from C0. Middle C is C4 because it’s 4 octaves above C0. The highest note on a piano is C8.

Math

A4, the A above middle C, has a frequency of 440 Hz. This is nine half steps above C4, so the pitch of C4 is 440*2−9/12. C0 is four octaves lower, so it’s 2−4 = 1/16 of the pitch of C4. (Details for this calculation and the one below are given in here.)

For a pitch P, the number of half steps from C0 to P is

h = 12 log2(P / C0).

Software

Here is a page that will let you convert back and forth between frequency and music notation: Music, Hertz, Barks.

If you’d like code rather than just to do one calculation, see the Python code below. It calculates the number of half steps h from C0 up to a pitch, then computes the corresponding pitch notation.

from math import log2, pow

A4 = 440
C0 = A4*pow(2, -4.75)
name = ["C", "C#", "D", "D#", "E", "F", "F#", "G", "G#", "A", "A#", "B"]
    
def pitch(freq):
    h = round(12*log2(freq/C0))
    octave = h // 12
    n = h % 12
    return name[n] + str(octave)

The pitch for A4 is its own variable in case you’d like to modify the code for a different tuning. While 440 is common, it used to be lower in the past, and you’ll sometimes see higher values like 444 today.

If you’d like to port this code to a language that doesn’t have a log2 function, you can use log(x)/log(2) for log2(x).

Powers of 2

When scientific pitch notation was first introduced, C0 was defined to be exactly 16 Hz, whereas now it works out to around 16.35. The advantage of the original system is that all C’s have frequency a power of 2, i.e. Cn has frequency 2n+4 Hz. The formula above for the number of half steps a pitch is above C0 simplifies to

h = 12 log2P − 48.

If C0 has frequency 16 Hz, the A above middle C has frequency 28.75 = 430.54, a little flat compared to A 440. But using the A 440 standard, C0 = 16 Hz is a convenient and fairly accurate approximation.

More posts on music and acoustics

Fourier transform of a function on a graph

What is a Fourier transform at its core? An expansion of function in terms of eigenfunctions of the Laplacian. For a function on the real line, the Laplacian is simply the second derivative. The functions mapped to multiples of themselves by taking second derivatives are sines and cosines of various frequencies. A Fourier series is a change of basis, using as basis vectors those functions who behave the simplest under the second derivative.

The Fourier transform of a function on a graph is also a change of basis, expanding a discrete function in terms of eigenvalues of the Laplacian, in this case the graph Laplacian.

The Fourier transform of a function f, evaluated at a frequency ω, is the inner product of f with the eigenfunction exp(2πiωt).

\hat{f}(\omega) = \langle f, \exp(2\pi i \omega t) \rangle = \int_{-\infty}^\infty f(t) \exp(-2\pi i \omega t) \, dx

The inner product of two complex functions f and g is the integral of the product of f and the conjugate of g. Conjugation is why exp(2πiωt) became exp(-2πiωt).

The Fourier transform of a discrete function f on a graph, evaluated at an eigenvalue λi, is the inner product of f (i.e. the vector of values of f at each node) with the eigenvector associated with λi.

\hat{f}(\lambda_i) = \langle f, v^*_i \rangle = \sum_{j=1}^N f(j) v_i^*(j)

Here the inner product is a discrete sum rather than an integral. As before, we take the complex conjugate of the second item in the product.

The eigenvectors associated with the smallest eigenvalues of the graph Laplacian are analogous to low frequency sines and cosines. The eigenvalue components corresponding to nearly vertices in a graph should be close together. This analogy explains why spectral coordinates work so well.

Related posts

Connection between hypergeometric distribution and series

What’s the connection between the hypergeometric distributions, hypergeometric functions, and hypergeometric series?

The hypergeometric distribution is a probability distribution with parameters NM, and n. Suppose you have an urn containing N balls, M red and the rest, N – M blue and you select n balls at a time. The hypergeometric distribution gives the probability of selecting k red balls.

The probability generating function for a discrete distribution is the series formed by summing over the probability of an outcome k and xk. So the probability generating function for a hypergeometric distribution is given by

f(x) = \sum \frac{{M\choose k}{N-M \choose n-k}}{{N \choose n}} x^k

The summation is over all integers, but the terms are only non-zero for k between 0 and M inclusive. (This may be more general than the definition of binomial coefficients you’ve seen before. If so, see these notes on the general definition of binomial coefficients.)

It turns out that f is a hypergeometric function of x because it can be written as a hypergeometric series. (Strictly speaking,  f is a constant multiple of a hypergeometric function. More on that in a moment.)

A hypergeometric function is defined by a pattern in its power series coefficients. The hypergeometric function F(a, bcx) has the power series

F(a, b; c) = \frac{(a)_k (b)_k}{(c)_k} \frac{x^k}{k!}

where (n)k is the kth rising power of n. It’s a sort of opposite of factorial. Start with n and multiply consecutive increasing integers for k terms. (n)0 is an empty product, so it is 1. (n)1 = n, (n)2 = n(n+1), etc.

If the ratio of the k+1st term to the kth term in a power series is a polynomial in k, then the series is a (multiple of) a hypergeometric series, and you can read the parameters of the hypergeometric series off the polynomial. This ratio for our probability generating function works out to be

\frac{P(X=k+1)}{P(X=k)} = \frac{(k-M)(k-n)}{(k+N-M-n+1)(k+1)}

and so the corresponding hypergeometric function is F(−M, −nNMn + 1; x). The constant term of a hypergeometric function is always 1, so evaluating our probability generating function at 0 tells us what the constant is multiplying F(−M, −nNMn + 1; x). Now

f(0) = P(X = 0) = \frac{{N-M \choose n}}{{N \choose n}}

and so

f(x) = \frac{{N-M \choose n}}{{N \choose n}} F(-M, -n; N - M - n + 1; x)

The hypergeometric series above gives the original hypergeometric function as defined by Gauss, and may be the most common form in application. But the definition has been extended to have any number of rising powers in the numerator and denominator of the coefficients. The classical hypergeometric function of Gauss is denoted 2F1 because it has two falling powers on top and one on bottom. In general, the hypergeometric function pFq has p rising powers in the numerator and q rising powers in the denominator.

The CDF of a hypergeometric distribution turns out to be a more general hypergeometric function:

P(X \leq k) = 1 - \frac{{n\choose k+1}{N-n\choose M-k-1}}{{N\choose M}} \phantom{ }_3F_2(1, k+1-M, k+1-n; k+2, N+k+2-M-n; 1)

where a = 1, bk+1−M, ck+1−n, d = k+2, and eN+k+2−Mn.

Thanks to Jan Galkowski for suggesting this topic via a comment on an earlier post, Hypergeometric bootstrapping.