Halley’s variation on Newton’s method

Newton’s method for solving f(x) = 0 converges quickly once it starts to converge. Specifically, it converges quadratically: the error is roughly squared at each step. This means that the number of correct decimal places doubles at each iteration of Newton’s method.

Doubling the number of decimal places is nice, but what if we could triple the number of correct decimals at each step? Edmond Halley, best known for the comet that bears his name, came up with a way to do just that. Newton’s method converges quadratically, but Halley’s method converges cubically.

Newton’s method updates iterations using the rule

x_{n+1} = x_n + \frac{f(x_n)}{f'(x_n)}

Halley’s variation uses the rule

x_{n+1} = x_n - \frac{1}{\dfrac{f'(x_n)}{f(x_n)} - \dfrac{f''(x)}{2f'(x)}}

Halley’s method makes more progress per iteration, but it also takes more work per iteration, and so in practice it’s not usually an improvement over Newton’s method. But in some cases it could be.

Evaluating efficiency

In root-finding problems, the function f is usually relatively time-consuming to evaluate. We can assume nearly all the work in root-finding goes into evaluating f and its derivatives, and we can ignore the rest of the arithmetic in the method.

Newton’s method requires evaluating the function f and its derivative f ′. Halley’s method requires these function evaluates as well and also requires evaluating the second derivative f ′′.

Three iterations of Newton’s method make as much progress toward finding a root as two iterations of Halley’s method. But since Newton’s method requires two function evaluations and Halley’s method requires three, both require six function evaluations to make the same amount of progress. So in general Halley’s method is not an improvement over Newton’s method.

When Halley might be better

Suppose we had a way to quickly compute the second derivative of f at a point from the values of f and its first derivative at that point, rather than by having to evaluate the second derivative explicitly. In that case two iterations of Halley’s method might make as much progress as three iterations of Newton’s method but with less effort, four function evaluations rather than six.

Many of the functions that are used most in applied mathematics satisfy 2nd order differential equations, and so it is common to be able to compute the second derivative from the function and its derivative.

For example, suppose we want to find the zeros of Bessel functions Jν. Bessel functions satisfy Bessel’s differential equation; that’s where Bessel functions get their name.

x^2 y'' + x y' + \left(x^2 - \nu^2 \right) y = 0

This means that once we have evaluated Jν and its first derivative, we can compute the second derivative from these values as follows.

J_{\nu}''(x_n) = \frac{(\nu^2 - x_n^2)J_\nu(x_n) - x_nJ_\nu'(x_n)}{x_n^2}

Maybe we’re not working with a well-studied function like a Bessel function but rather we are numerically solving a differential equation of our own creation and we want to know where the solution is zero. Halley’s method would be a natural fit because our numerical method will give us the values of y and y ′ at each step.

Related posts

Three advantages of non-AI models

It’s hard to imagine doing anything like Midjourney’s image generation without neural networks. The same is true of ChatGPT’s text generation. But a lot of business tasks do not require AI, and in fact would be better off not using AI. Three reasons why:

  1. Statistical models are easier to interpret. When a model has a dozen parameters, you can inspect each one. When a model has a billion parameters, not so much.
  2. Statistical models are more robust. Neural networks perform well on average, but fail in bizarre ways, and there is no way to explore all the possible edge cases. The edge cases of a statistical model can be enumerated, examined, and mitigated.
  3. Statistical models are not subject to legislation hastily written in response to recent improvements in AI. The chances that such legislation will have unintended consequences are roughly 100%.

Eccentricity of bivariate normal level sets

Suppose you have a bivariate normal distribution with correlation ρ where

f(x,y) = \frac{1}{2\pi \sqrt{1-\rho^2}} \exp\left(-\frac{x^2 - 2\rho xy + y^2}{2(1-\rho^2)} \right)

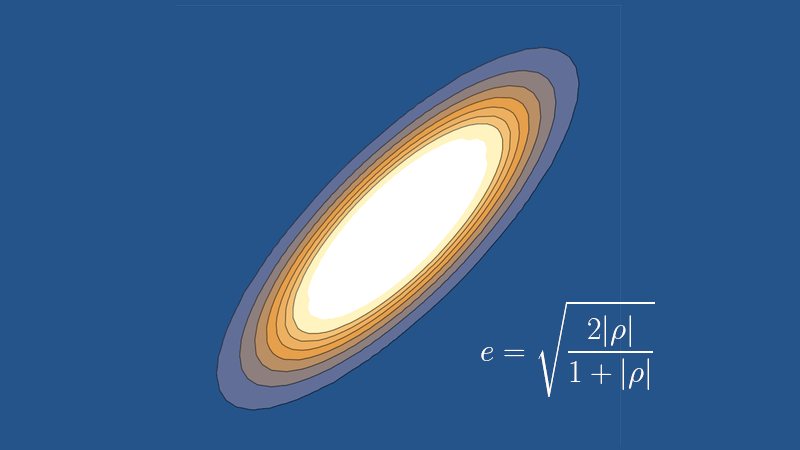
Then the level sets of the density function are ellipses, and the eccentricity e of the ellipses is related to the correlation ρ by

\begin{align*} \rho &= \pm \frac{e^2}{2 - e^2} \\ e &= \sqrt{\frac{2|\rho|}{1 + |\rho|} } \end{align*

Plots

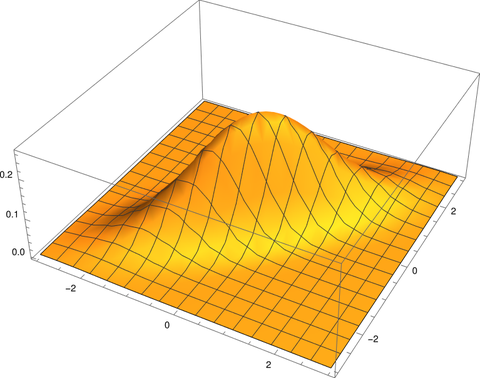
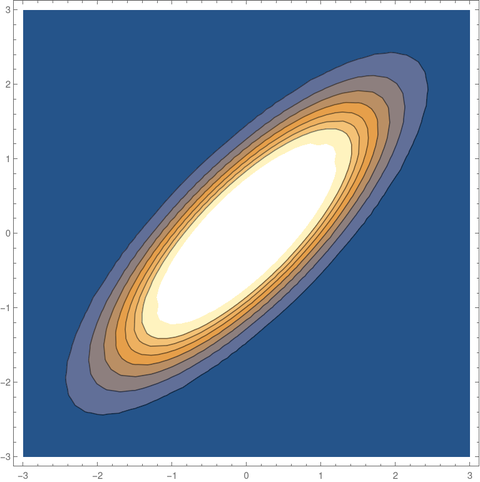
For example, suppose ρ = 0.8.

Here’s a plot of the density function f(x, y).

And here is a plot of the contours, the level sets obtained by slicing the plot of the density horizontally.

Eccentricity and aspect ratio

The equation above says that since ρ = 0.8 the eccentricity e should be √(1.6/1.8) = 0.9428.

As I’ve written about several times, eccentricity is a little hard to interpret. It’s a number between 0 and 1, with 0 being a circle and 1 being a degenerate ellipse collapsed to a line segment. Since 0.9428 is closer to 1 than to 0, you might think that an ellipse with such a large value of e is very far from circular. But this is not the case.

Eccentric literally means off-center. Eccentricity measures how far off-center the foci of an ellipse are. This is related to how round or thin an ellipse is, but only indirectly. It is true that such a large value of e means that the foci are close to the ends of the ellipse. In fact, the foci are located at 94.28% of the distance from the center to the end of the semimajor axes. But the aspect ratio is more moderate.

It’s easier to imagine the shape of an ellipse from the aspect ratio than from the eccentricity. Aspect ratio r is related to eccentricity e by

r = \sqrt{1-e^2}

Using the expression above for eccentricity e as a function of correlation ρ we have

r = \sqrt{\frac{1 - |\rho|}{1 + |\rho|}}

This says our aspect ratio should be 1/3. So although our ellipse is highly eccentric—the foci are near the ends—it isn’t extraordinarily thin. It’s three times longer than it is wide, which matches the contour plot above.

Related posts

Bounds on the incomplete beta function (beta CDF)

The incomplete beta function is defined by

B(x, y, z) = \int_0^z t^{x-1} (1-t)^{y-1} \, dx

It is called incomplete because the limit of integration doesn’t necessarily run all the way up to 1. When z = 1 the incomplete beta function is simply the beta function

B(x, y) = B(x, y, 1)

discussed in the previous post [1].

The incomplete beta function is proportional to the CDF of a beta random variable, and the proportionality constant is 1/B(x, y). That is, if X is a beta(a, b) random variable, then

\text{Prob}(X \leq x) = \frac{B(a, b, x)}{B(a, b)}

The right-hand side of the equation above is often called the regularized incomplete beta function. This is what an analyst would call it. A statistician would call it the beta distribution function.

The previous post gave simple bounds on the (complete) beta function. This post gives bounds on the incomplete beta function. These bounds are more complicated but also more useful. The incomplete beta function is more difficult to work with than the beta function, and so upper and lower bounds are more appreciated.

One application of these bounds would be to speed up software that evaluates beta probabilities. If you only need to know whether a probability is above or below some threshold, you could first compute an upper or lower bound. Maybe computing the exact probability is unnecessary because you can decide from your bounds whether the probability is above or below your threshold. If not, then you compute the exact probability. This is less work if your bounds are usually sufficient, and more work if they’re usually not. In the former case this could result in a significant speed up because the incomplete beta function is relatively expensive to evaluate.

Cerone, cited in the previous post, gives two lower bounds, L1 and L2, and two upper bounds, U1 and U2, for B(x, y, z). Therefore the maximum of L1 and L2 is a lower bound and the minimum of U1 and U2 is an upper bound. The bounds are complicated, but easier to work with than the incomplete beta function.

\begin{align*} L_1 &= \frac{z^{x-1}}{y} \left[ \left(1 - z + \frac{z}{x} \right)^y - (1-z)^y \right] \\ U_1 &= \frac{z^{x-1}}{y} \left[ 1 - \left(1 - \frac{z}{x}\right)^y\right] \\ L_2 &= \frac{\lambda(z)^x}{x} + (1-z)^{y-1}\, \frac{z^x - \lambda(z)^x}{x} \\ U_2 &= (1-z)^{y-1} \frac{\left( x - \lambda(z) \right)^x}{x} + \frac{z^x - \left(z - \lambda(z)\right)^x}{x} \\ \end{align*}

where

\lambda(z) = \frac{1 - (1-z)[1 - z(1-y)]}{y\left[1-(1-z)^{y-1}\right]}

Related posts

[1] Incidentally, Mathematica overloads the Beta function just as we overload B. Mathematica’s Beta[x, y] corresponds to our B(x, y), but the three-argument version of Beta, the incomplete beta function, puts the limit of integration z first. That is, our B(x, y, z) corresponds to Beta[z, x, y] in Mathematica.

Upper and lower bounds on the beta function

The beta function B(x, y) is defined by

B(x, y) = \int_0^1 t^{x-1} (1-t)^{y-1}\, dt

and is the normalizing constant for the beta probability distribution. It is related to the gamma function via

B(x, y) = \frac{\Gamma(x)\,\Gamma(y)}{\Gamma(x+y)}

The beta function comes up often in applications. It can be challenging to work with, however, and so estimates for the function are welcome.

The function 1/xy gives simple approximation and upper bound for B(x, y). Alzer [1] proved that when x > 1 and y > 1

0 \leq \frac{1}{xy} - B(x,y) \leq b

where the constant b is defined by

b = \max_{x\geq1}\left( \frac{1}{x^2} - \frac{\Gamma(x)^2}{\Gamma(2x)} \right) = 0.08731\ldots

Cerone [2] gives a different bound which varies with x and y and is usually better than Alzer’s bound. For x and y greater than 1, Cerone shows

0 \leq \frac{1}{xy} - B(x,y) \leq C(x) C(y) \leq b'

where

C(x) = \frac{x-1}{x\sqrt{2x-1}}

and

C(x) = \frac{x-1}{x\sqrt{2x-1}}

Cerone’s bound is slightly larger in the worst case, near x = y = (3 + √5)/2, but is smaller in general.

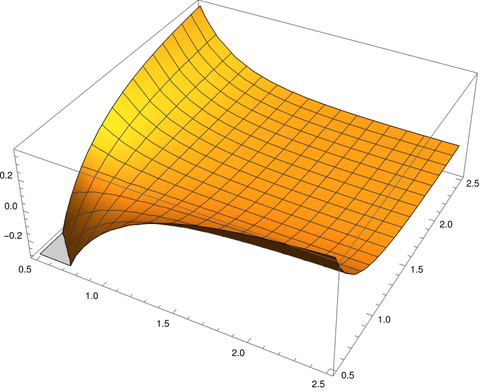
The difference between B(x, y) and 1/xy is largest when x or y is small. We can visualize this with the Mathematica command

    Plot3D[Beta[x, y] - 1/(x y), {x, 0.5, 2.5}, {y, 0.5, 2.5}]

which produces the following plot.

The plot dips down in the corner where x and y are near 0.5 and curls upward on the edges where one of the variables is near 0.5 and the other is not.

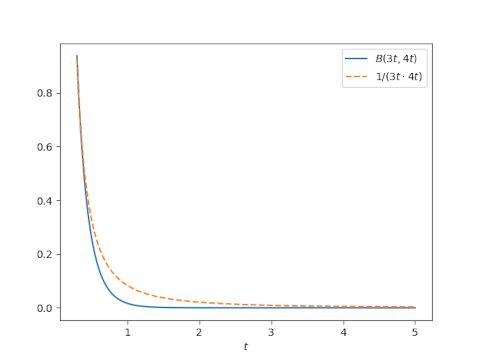
Let’s look at B(x, y) and 1/xy at along a diagonal slice (3t, 4t).

This suggests that approximating B(x, y) with 1/xy works best when the arguments are either small or large, with the maximum difference being when the arguments are moderate-sized. In the plot we see B(3, 4) is not particularly close to 1/12.

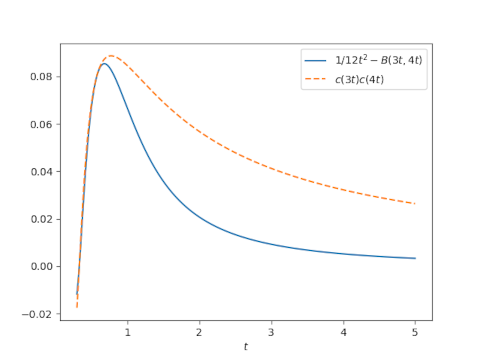
Next lets look at 1/xyB(x, y) along the same diagonal slice.

This shows that the error bound C(x) C(y) is not too tight, but better than the constant bound except near the maximum of 1/xyB(x, y).

Related posts

[1] H. Alzer. Monotonicity properties of the Hurwitz zeta function. Canadian Mathematical Bulletin 48 (2005), 333–339.

[2] P. Cerone. Special functions: approximations and bounds. Applicable Analysis and Discrete Mathematics, 2007, Vol. 1, No. 1, pp. 72–91

nth root of n!

Last week the function

b(n) = \exp\left(\frac{\log n!}{n} \right ) = \sqrt[n]{n!}

came up in a blog post as the solution to the equation n! = bn.

After writing that post I stumbled upon an article [1] that begins by saying, in my notation,

The function b(x) … has many applications in pure and applied mathematics.

The article mentions a couple applications but mostly focuses on approximations and bounds for the function b(x) and especially for the ratio b(x)/b(x + 1). In the article x is a positive real number, not necessarily an integer.

b(x) = \Gamma(x+1)^{1/x}

One of the results is the approximation

\frac{b(x)}{b(x+1)} \approx \left(\sqrt{2\pi x}\right)^{\frac{1}{x(x+1)}}

which is the beginning of an asymptotic series given in the paper.

Another result is the following upper and lower bounds on b(n).

\exp\left(-\frac{1}{2x}\right) < \left(1 + \frac{1}{x}\right)^x \frac{b(x)}{x \left(\sqrt{2\pi x}\right)^{1/x}} < \exp\left(-\frac{1}{2x} + \frac{5}{12x^2}\right)

Let’s look at some examples of these results using the following Python script.

    from numpy import exp, pi
    from scipy.special import loggamma
    
    b = lambda x: exp(loggamma(x+1)/x)
    
    bratio = lambda x: b(x)/b(x+1)
    
    bratio_approx = lambda x: (2*pi*x)**(0.5/(x*(x+1)))
    
    def lower_bound_b(x):
        r = exp(-0.5/x) * x*(2*pi*x)**(0.5/x)
        r /= (1 + 1/x)**x
        return r
    
    def upper_bound_b(x):
        return lower_bound_b(x)*exp(5/(12*x*x))
    
    for x in [25, 100, 1000]:
        print(bratio(x), bratio_approx(x))
    
    for x in [25, 100, 1000]:
        print(lower_bound_b(x), b(x), upper_bound_b(x))

The code exercising the ratio approximation prints

    0.964567 1.003897
    0.990366 1.000319
    0.999004 1.000004

and the code exercising the lower and upper bounds prints the following.

     10.170517  10.177141   10.177299
     37.991115  37.992689   38.992698
    369.491509 369.491663  369.491663

[1] Chao-Ping Chen and Cristinel Mortici. Asymptotic expansions and inequalities relating to the gamma function. Applicable Analysis and Discrete Mathematics, Vol. 16, No. 2 (October, 2022), pp. 379–399

Activation functions and Iverson brackets

Neural network activation functions transform the output of one layer of the neural net into the input for another layer. These functions are nonlinear because the universal approximation theorem, the theorem that basically says a two-layer neural net can approximate any function, requires these functions to be nonlinear.

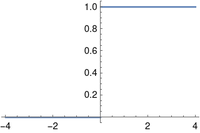
Heaviside function plot

Activation functions often have two-part definitions, defined one way for negative inputs and another way for positive inputs, and so they’re ideal for Iverson notation. For example, the Heaviside function plotted above is defined to be

f(x) = \left\{ \begin{array}{ll} 1 & \mbox{if } x > 0 \\ 0 & \mbox{if } x \leq 0 \end{array} \right.

Kenneth Iverson’s bracket notation, first developed for the APL programming language but adopted more widely, uses brackets around a Boolean expression to indicate the function that is 1 when the expression is true and 0 otherwise. With this notation, the Heaviside function can be written simply as

f(x) = [x > 0]

Iverson notation is fairly common, but not quite so common that I feel like I can use it without explanation. I find it very handy and would like to popularize it. The result of the post will give more examples.

ReLU

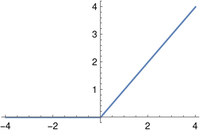
The popular ReLU (rectified linear unit) function is defined as

f(x) = \left\{ \begin{array}{ll} x & \mbox{if } x > 0 \\ 0 & \mbox{if } x \leq 0 \end{array} \right.

and with Iverson bracket notation as

f(x) = x[ x> 0]

The ReLU activation function is the identity function multiplied by the Heaviside function. It’s not the best example of the value of bracket notation since it could be written simply as max(0, x). The next example is better.

ELU

ELU

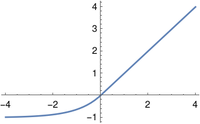
The ELU (exponential linear unit) is a variation on the ReLU that, unlike the ReLU, is differentiable at 0.

f(x) = \left\{ \begin{array}{ll} x & \mbox{if } x > 0 \\ e^x - 1 & \mbox{if } x \leq 0 \end{array} \right.

The ELU can be described succinctly in bracket notation.

f(x) = (e^x-1)[ x \leq 0] + x[x > 0]

PReLU

PReLU -- parameterized rectified linear unit -- graph

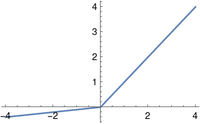
The PReLU (parametric rectified linear unit) depends on a small positive parameter a. This parameter must not equal 1, because then the function would be linear and the universal approximation theorem would not apply.

f(x) = \left\{ \begin{array}{ll} x & \mbox{if } x > 0 \\ ax & \mbox{if } x \leq 0 \end{array} \right.

In Iverson notation:

f(x) = ax[ x \leq 0] + x[x > 0]

Related posts

Cayley graphs in Mathematica

The previous post mentioned the group S4, the group of all permutations of a set with four elements. This post will show a way to visualize this group.

The Mathematica command

    CayleyGraph[
        SymmetricGroup[4], 
        VertexLabels -> Placed["Name", Center],
        VertexSize -> 0.4]

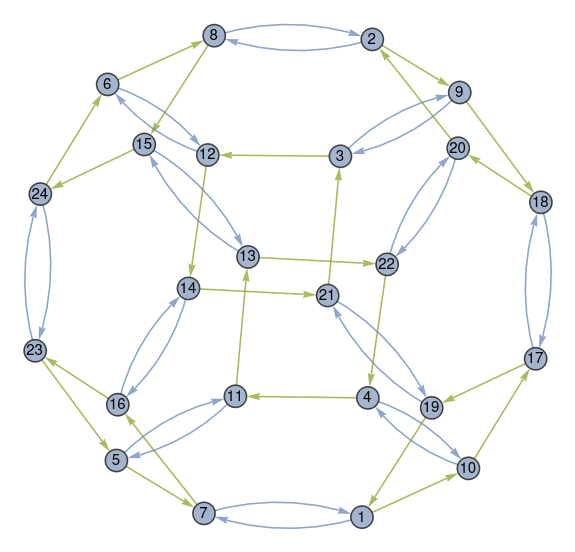
generates the graph below.

Cayley graph of alternating group S4

This is an interesting image, but what does it mean?

The elements of S4 are represented by the circled numbers. The numbers correspond to the permutations of four elements, listed in lexicographical order. If you label the four elements a, b, c, and d then the permutations are listed in alphabetical order. Permutation 1 is [1, 2, 3, 4] to itself and Permutation 24 is its reverse [4, 3, 2, 1].

In the Mathematica application, mousing over a number shows which permutation it represents, though the static image above doesn’t have this feature.

The blue arrows represent the permutation that swaps the first two elements. So the blue arrow between node 1 and node 7 says that swapping the first two elements of Permutation 1 gives you Permutation 7, which is [2, 1, 3, 4]. The blue arrow going back from 7 to 1 says that the same swapping operation applied to Permutation 7 returns you to Permutation 1.

All the blue arrows come in pairs because swapping is its own inverse.

The green arrows represent a rotation. For example, the green arrow from 1 to 10 says that rotation turns [1, 2, 3, 4] into [2, 3, 4, 1]. The rotation operation is not its own inverse, so the arrows only go in one direction. But every green arrow is part of a diamond because applying the rotation operation four times sends you back where you started.

You can get from any permutation to any other permutation by repeatedly either swapping the first two elements or applying a rotation. In group theoretical terminology, these two permutations generate the group S4.

Related posts

Permutations and centralizers in Mathematica

I had a fleeting thought about how little I use group theory when I realize I used it just this week.

A couple days ago I needed to know which permutations of 4 elements commute with reversal. If r takes a sequence and reverses it, I need to find all permutations p such that pr = rp.

In group theory jargon, the group of all permutations of 4 elements is the symmetric group S4. The subgroup of elements that commute with r is the centralizer of r. So my task was to find the centralizer of r in S4. How do I pose this task to Mathematica?

Mathematica represents permutations as disjoint cycles. The permutation r is represented as

    Cycles[{{4, 1}, {2, 3}}]

because swapping the first and last elements, then swapping the middle two elements, reverses a list of four elements.

To find the centralizer of r I asked Mathematica

    GroupCentralizer[SymmetricGroup[4], Cycles[{{4, 1}, {2, 3}}]]

This returns

    PermutationGroup[{Cycles[{{1, 4}}], Cycles[{{2, 3}}], Cycles[{{1, 2}, {3, 4}}]}]

This does list the permutations that commute with r but rather the generators of the group of such permutations. If we ask for the elements of the group above with

    GroupElements[%]

this returns

    {Cycles[{}], 
     Cycles[{{2, 3}}], 
     Cycles[{{1, 2}, {3, 4}}], 
     Cycles[{{1, 2, 4, 3}}], 
     Cycles[{{1, 3, 4, 2}}], 
     Cycles[{{1, 3}, {2, 4}}], 
     Cycles[{{1, 4}}], 
     Cycles[{{1, 4}, {2, 3}}]}

I use basic group theory and other algebra all the time, but I don’t think of it that way. In this example, I had a question about permutations, and it only occurred to me later that I could phrase my question in the vocabulary of group theory. I use ideas from algebra more often than I use the vocabulary of algebra.

Related posts

Floors and roots

I recently stumbled across the identity

\left\lfloor \sqrt{n} + \sqrt{n+1} + \sqrt{n+2}\right\rfloor = \left\lfloor \sqrt{9x+8}\right\rfloor

while reading [1]. Here ⌊x⌋ is the floor of x, the largest integer not larger than x.

My first thought was that this was hard to believe. Although the floor function is very simple, its interactions with other functions tends to be complicated. I was surprised that such a simple equation was true.

My second thought was that the equation makes sense. For large n the three terms on the left are roughly equal, and so

\sqrt{n} + \sqrt{n+1} + \sqrt{n+2} \approx 3 \sqrt{n+1} = \sqrt{9n + 9}

Not only that, the approximation gets better as n gets larger. So the theorem is at least plausible.

My third thought was that there is something subtle going on here. Why the 8 on the right hand side? It turns out the theorem is false if you replace the 8 with a 9. Equality fails to hold for n = 0, 3, 8, 15, …

There is a difference between saying xy and saying ⌊x⌋ = ⌊y⌋. The former makes the latter plausible, but it’s not the same. If x and y are very close, but on opposite sides of an integer, then ⌊x⌋ ≠ ⌊y⌋.

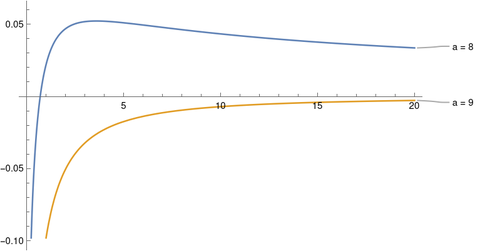
In fact, the approximation

\sqrt{n} + \sqrt{n+1} + \sqrt{n+2} \approx \sqrt{9n+a}

is better when a = 9 than when a = 8. Here’s a plot of the approximation errors.

So there’s something clever going on with the selection a = 8.

According to [1], the equation at the top was proposed as a problem in 1988 and a solution was published in 2005. The time span between the proposed theorem and its proof suggests that the proof isn’t trivial, though I have not yet read it.

This is an obscure problem, and so we can’t assume that hundreds of mathematicians were feverishly trying to find a solution for 17 years. On the other hand, if there were a trivial proof it seems someone would have posted it quickly.

[1] Prapanpong Pongsriiam. Analytic Number Theory for Beginners, 2nd edition.. American Mathematical Society 2023