Efficiently testing a black box

Suppose you have a black box that takes three bits as input and produces one bit as output. You could think of the input bits as positions of toggle switches, and the output bit as a light attached to the box that is either on or off.

Full factorial design

Now suppose that only one combination of 3 bits produces a successful output. There’s one way to set the switches that makes the light turn on. You can find the successful input by brute force if you test all 2³ = 8 possible inputs. In statistical lingo, you are conducting an experiment with a factorial design, i.e. you test all combinations of inputs.

See the Python code below for a text version of this design

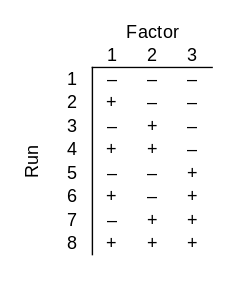
In the chart above, each row is an experimental run and each column is a bit. I used − and + rather than 0 and 1 because it is conventional in this topic to use a minus sign to indicate that a factor is not present and a plus sign to indicate that it is present.

Fractional factorial design

Now suppose your black box takes 4 bits as inputs, but only 3 of them matter. One of the bits does nothing, but you don’t know which bit that is. You could use a factorial design again, testing all 24 = 16 possible inputs. But there’s a more clever approach that requires only 8 guesses. In statistical jargon, this is a fractional factorial design.

See the Python code below for a text version of this design

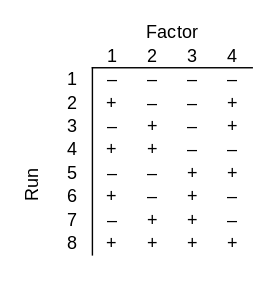
No matter which three bits the output depends on, all combinations of those three bits will be tested. Said another way, if you delete any one of the four columns, the remaining columns contain all combinations of those bits.

Replications

Now suppose your black box takes 8 bits. Again only 3 bits matter, but you don’t know which 3. How many runs do you need to do to be certain of finding the successful combination of 3 bits? It’s clear that you need at least 8 runs: if you know that the first three bits are the important ones, for example, you still need 8 runs. And it’s also clear that you could go back to brute force and try all 28 = 256 possible inputs, but the example above raises your hopes that you could get by with less than 256 runs. Could you still get by with 8? That’s too much to hope for, but you could use only 16 runs.

--------, +----+++, -+--+-++, ++--++--, --+-+++-, +-+-+--+, -++--+-+, +++---+-, ---+++-+, +--++-+-, -+-+-++-, ++-+---+, --++--++, +-++-+--, -++++---, ++++++++

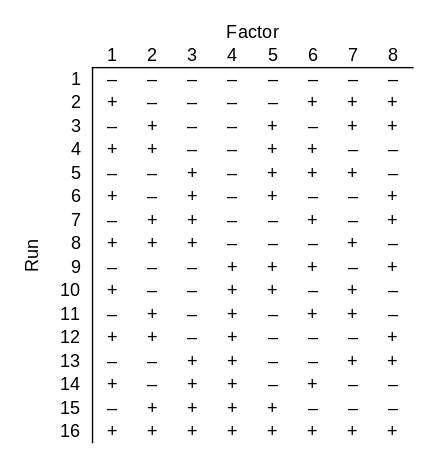
Note that since this design works for 8 factors, it also works for fewer factors. If you had 5, 6, or 7 factors, you could use the first 5, 6, or 7 columns of the design above.

This design has some redundancy: every combination of three particular bits is tested twice. This is unfortunate in our setting because we are assuming the black box is deterministic: the right combination of switches will always turn the light on. But what if the right combination of switches probably turns on the light? Then redundancy is a good thing. If there’s an 80% chance that the right combination will work, then there’s a 96% chance that at least one of the two tests of the right combination will work.

Fractional factorial experiment designs are usually used with the assumption that there are random effects, and so redundancy is a good thing.

You want to test each main effect, i.e. each single bit, and interaction effects, i.e. combinations of bits, such as pairs of bits or triples of bits. But you assume that not all possible interactions are important; otherwise you’d need a full factorial design. You typically hit diminishing returns with interactions quickly: pairs of effects are often important, combinations of three effects are less common, and rarely would an experiment consider fourth order interactions.

If only main effects and pairs of main effects matter, and you have a moderately large number of factors n, a fractional factorial design can let you use a lot less than 2n runs while giving you as many replications of main and interaction effects as you want.

Verification

The following Python code verifies that the designs above have the claimed properties.

    import numpy as np
    from itertools import combinations
    
    def verify(matrix, k):
        "verify that every choice of k columns has 2^k unique rows"
        nrows, ncols = matrix.shape
        for (a, b, c) in combinations(range(ncols), k):
            s = set()
            for r in range(nrows):
                s.add((matrix[r,a], matrix[r,b], matrix[r,c]))
            if len(s) != 2**k:
                print("problem with columns", a, b, c)
                print("number of unique elements: ", len(s))
                print("should be", 2**k)
                return
        print("pass")
    
    m = [
        [-1, -1, -1, -1],
        [-1, -1, +1, +1],
        [-1, +1, -1, +1],
        [-1, +1, +1, -1],
        [+1, -1, -1, +1],
        [+1, -1, +1, -1],
        [+1, +1, -1, -1],
        [+1, +1, +1, +1]
    ]
    
    verify(np.matrix(m), 3)
    
    m = [
        [-1, -1, -1, -1, -1, -1, -1, -1],
        [+1, -1, -1, -1, -1, +1, +1, +1],
        [-1, +1, -1, -1, +1, -1, +1, +1],
        [+1, +1, -1, -1, +1, +1, -1, -1],
        [-1, -1, +1, -1, +1, +1, +1, -1],
        [+1, -1, +1, -1, +1, -1, -1, +1],
        [-1, +1, +1, -1, -1, +1, -1, +1],
        [+1, +1, +1, -1, -1, -1, +1, -1],
        [-1, -1, -1, +1, +1, +1, -1, +1],
        [+1, -1, -1, +1, +1, -1, +1, -1],
        [-1, +1, -1, +1, -1, +1, +1, -1],
        [+1, +1, -1, +1, -1, -1, -1, +1],
        [-1, -1, +1, +1, -1, -1, +1, +1],
        [+1, -1, +1, +1, -1, +1, -1, -1],
        [-1, +1, +1, +1, +1, -1, -1, -1],
        [+1, +1, +1, +1, +1, +1, +1, +1],
    ]
    
    verify(np.matrix(m), 3)

Related services

Which one is subharmonic?

The Laplace operator Δ of a function of n variables is defined by

\Delta f = \sum_{i=1}^n \frac{\partial^2 f}{\partial x^2_i}

If Δ f = 0 in some region Ω, f is said to be harmonic on Ω.  In that case f takes on its maximum and minimum over Ω at locations on the boundary ∂Ω of Ω. Here is an example of a harmonic function over a square which clearly takes on its maximum on two sides of the boundary and its minimum on the other two sides.

Plot of x^2 - y^2 over [-1,1] cross [-1,1].

The theorem above can be split into two theorems and generalized:

If Δ f ≥ 0, then f takes on its maximum on ∂Ω.

If Δ f ≤ 0, then f takes on its minimum on ∂Ω.

These two theorems are called the maximum principle and minimum principle respectively.

Now just as functions with Δf equal to zero are called harmonic, functions with Δf non-negative or non-positive are called subharmonic and superharmonic. Or is it the other way around?

If Δ f ≥ 0 in Ω, then f is called subharmonic in Ω. And if Δ f ≤ 0 then f is called superharmonic. Equivalently, f is superharmonic if −f is subharmonic.

The names subharmonic and superharmonic may seem backward: the theorem with the greater than sign is for subharmonic functions, and the theorem with the less than sign is for superharmonic functions. Shouldn’t the sub-thing be less than something and the super-thing greater?

Indeed they are, but you have to look f and not Δf. That’s the key.

If a function f is subharmonic on Ω, then f is below the harmonic function interpolating f from ∂Ω into the interior of Ω. That is, if g satisfies Laplace’s equation

\begin{align*} \Delta g &= 0 \mbox{ on }\Omega \\ g &= f \mbox{ on } \partial\Omega \end{align*}

then fg on Ω.

For example, let f(x) = ||x|| and let Ω be the unit ball in ℝn. Then Δ f ≥ 0 and so f is subharmonic. (The norm function f has a singularity at the origin, but this example can be made rigorous.) Now f is constantly 1 on the boundary of the ball, and the constant function 1 is the unique solution of Laplace’s equation on the unit ball with such boundary condition, and clearly f is less than 1 on the interior of the ball.

Related posts

Ideograph numerals

This post is a follow on to my previous post on Unicode numbers. I always welcome feedback from readers, but I especially welcome it here because I’m walking into an area I know next to nothing about.

Consecutive code points

Unicode generally assigns code points to number-like things in consecutive order. For example, the Python code

    for n in range(1,10):
        print(chr(0x30+n), chr(0x24f4+n), chr(0x215f+n))

prints

    1 ⓵ Ⅰ
    2 ⓶ Ⅱ
    3 ⓷ Ⅲ
    4 ⓸ Ⅳ
    5 ⓹ Ⅴ
    6 ⓺ Ⅵ
    7 ⓻ Ⅶ
    8 ⓼ Ⅷ
    9 ⓽ Ⅸ

showing that ASCII digits, circled numerals, and Roman numerals are encoded consecutively.

Parenthesized and circled ideographs

So the same is probably true for ideographs representing digits, right?

一 二 三 四 五 六 七 八 九 ㈠ ㈡ ㈢ ㈣ ㈤ ㈥ ㈦ ㈧ ㈨ ㊀ ㊁ ㊂ ㊃ ㊄ ㊅ ㊆ ㊇ ㊈

No, but before we get into that, the following code shows that parenthesized ideographs and circled ideographs for digits are numbered consecutively. The code

    from unicodedata import numeric, name

    for i in range(1, 10):
        cp = 0x321f + i
        ch = chr(cp)
        print(ch, hex(cp), numeric(ch), name(ch))
    
    for i in range(1, 10):
        cp = 0x327f + i
        ch = chr(cp)
        print(ch, hex(cp), numeric(ch), name(ch))    

prints

    ㈠ 0x3220 1.0 PARENTHESIZED IDEOGRAPH ONE
    ㈡ 0x3221 2.0 PARENTHESIZED IDEOGRAPH TWO
    ㈢ 0x3222 3.0 PARENTHESIZED IDEOGRAPH THREE
    ㈣ 0x3223 4.0 PARENTHESIZED IDEOGRAPH FOUR
    ㈤ 0x3224 5.0 PARENTHESIZED IDEOGRAPH FIVE
    ㈥ 0x3225 6.0 PARENTHESIZED IDEOGRAPH SIX
    ㈦ 0x3226 7.0 PARENTHESIZED IDEOGRAPH SEVEN
    ㈧ 0x3227 8.0 PARENTHESIZED IDEOGRAPH EIGHT
    ㈨ 0x3228 9.0 PARENTHESIZED IDEOGRAPH NINE
    ㊀ 0x3280 1.0 CIRCLED IDEOGRAPH ONE
    ㊁ 0x3281 2.0 CIRCLED IDEOGRAPH TWO
    ㊂ 0x3282 3.0 CIRCLED IDEOGRAPH THREE
    ㊃ 0x3283 4.0 CIRCLED IDEOGRAPH FOUR
    ㊄ 0x3284 5.0 CIRCLED IDEOGRAPH FIVE
    ㊅ 0x3285 6.0 CIRCLED IDEOGRAPH SIX
    ㊆ 0x3286 7.0 CIRCLED IDEOGRAPH SEVEN
    ㊇ 0x3287 8.0 CIRCLED IDEOGRAPH EIGHT
    ㊈ 0x3288 9.0 CIRCLED IDEOGRAPH NINE

CJK Unified Ideographs

Now let’s take the parentheses and circles off.

The following code shows that the CJK unified ideographs for digits are not digits (!) according to Unicode, but they are numeric. It also shows that their code points are not assigned in any apparent order.

    numerals = "一二三四五六七八九十"
    for n in numerals:
        print(n, hex(ord(n)), n.isdigit(), numeric(n))

This outputs the following.

    一 0x4e00 False 1.0
    二 0x4e8c False 2.0
    三 0x4e09 False 3.0
    四 0x56db False 4.0
    五 0x4e94 False 5.0
    六 0x516d False 6.0
    七 0x4e03 False 7.0
    八 0x516b False 8.0
    九 0x4e5d False 9.0
    十 0x5341 False 10.0

I assume the ordering of ideographs in Unicode has its own internal logic (with exceptions and historical quirks) that I know nothing about. If anyone knows of any patterns of how code points are assigned to ideographs, please let me know.

The names of the characters above say nothing about what the characters mean. For example, the official Unicode name for 九 (U+4E5D) is CJK UNIFIED IDEOGRAPH-4E5D. The name says nothing about the ideograph representing the digit 9, though the numeric property of the digit is indeed 9. My guess is that when that character represents a digit, it represents 9, but maybe it can mean other things in other contexts.

Unicode numbers

There are 10 digits in ASCII, and I bet you can guess what they are. In ASCII, a digit is a decimal is a number.

Things are much wilder in Unicode. There are hundreds of decimals, digits, and numeric characters, and they’re different sets.

 ꩓ ٦ ³ ⓶ ₅ ⅕ Ⅷ ㊈

The following Python code loops through all possible Unicode characters, extracting the set of decimals, digits, and numbers.

    numbers  = set()
    decimals = set() 
    digits   = set()

    for i in range(1, 0x110000):
        ch = chr(i)
        if ch.isdigit():
            digits.add(ch)
        if ch.isdecimal():
            decimals.add(ch)
        if ch.isnumeric():
            numbers.add(ch)

These sets are larger than you may expect. The code

    print(len(decimals), len(digits), len(numbers))

tells us that the size of the three sets are 650, 778, and 1862 respectively.

The following code verifies that decimals are a proper subset of digits and that digits are a proper subset of numerical characters.

    assert(decimals < digits < numbers)

Now let’s look at the characters in the image above. The following code describes what each character is and how it is classified. The first three characters are digits, the next three are decimals but not digits, and the last three are numeric but not decimals.

    from unicodedata import name
    for c in "꩓٦":
        print(name(c))
        assert(c.isdecimal())
    for c in "³⓶₅":
        print(name(c))    
        assert(c.isdigit() and not c.isdecimal())
    for c in "⅕Ⅷ㊈":
        print(name(c))    
        assert(c.isnumeric() and not c.isdigit())

The names of the characters are

  1. MATHEMATICAL DOUBLE-STRUCK DIGIT EIGHT
  2. CHAM DIGIT THREE
  3. ARABIC-INDIC DIGIT SIX
  4. SUPERSCRIPT THREE
  5. DOUBLE CIRCLED DIGIT TWO
  6. SUBSCRIPT FIVE
  7. VULGAR FRACTION ONE FIFTH
  8. ROMAN NUMERAL EIGHT
  9. CIRCLED IDEOGRAPH NINE

Update: See the next post on ideographic numerals.

Update: There are 142 distinct numbers that correspond to the numerical value associated with a Unicode character. This page gives a list of the values and an example of each value.

Related posts

Regex to match ICD-11 code

ICD codes are diagnostic codes created by the WHO. (Three TLAs in just the opening paragraph!)

The latest version, ICD-11, went into effect in January of this year. A few countries are using ICD-11 now; it’s expected to be at least a couple years before the US moves from ICD-10 to ICD-11. (I still see ICD-9 data even though ICD-10 came out in 1994.)

One way that ICD-11 codes differ from ICD-10 codes is that the new codes do not use the letters I or O in order to prevent possible confusion with the digits 1 and 0. In the code below, “alphabetic” and “alphanumeric” implicitly exclude the letters I and O.

Another way the codes differ is the that the second character in an ICD-10 is a digit whereas the second character in an ICD-11 code is a letter.

What follows is a heavily-commented regular expression for matching ICD-11 codes, along with a few tests to show that the regex matches things it should and does not match things it should not.

Of course you could verify an ICD-11 code by searching against an exhaustive list of such codes, but the following is much simpler and may match some false positives. However, it is future-proof against false negatives: ICD-11 codes added in the future will conform to the pattern in the regular expression.

import re

icd11_re = re.compile(r"""
    ^                  # beginning of string
    [A-HJ-NP-Z0-9]     # alphanumeric
    [A-HJ-NP-Z]        # alphabetic
    [0-9]              # digit
    [A-HJ-NP-Z0-9]     # alphanumeric
    ((\.               # optional starting with .
    [A-HJ-NP-Z0-9])    # alphanumeric
    [A-HJ-NP-Z0-9]?)?  # optional further refinement
    $                  # end of string
    """, re.VERBOSE)

good = [
    "ND52",   # fracture of arm, level unspecified
    "9D00.3", # presbyopia
    "8B60.Y", # other specified increased intercranial pressure
    "DB98.7Z" # portal hypertension, unspecified
]

bad = [
    "ABCD",    # third character must be digit
    "AB3D.",   # dot must be followed by alphanumeric
    "9D0O.3",  # letter 'O' should be number 0
    "DB9872",  # missing dot
    "AB3",     # too short
    "DB90.123" # too long
]

for g in good:
    assert(icd11_re.match(g))
for b in bad:
    assert(icd11_re.match(b) == None)

Related posts

The Very Model of a Professor Statistical

The last chapter of George Box’s book Improving Almost Anything contains the lyrics to “I Am the Very Model of a Professor Statistical,” to be sung to the tune of “I Am the Very Model of a Modern Major General” by Gilbert & Sullivan.

Here’s the original:

The original song has a few funny math-related lines.

I’m very well acquainted, too, with matters mathematical,
I understand equations, both the simple and quadratical,
About binomial theorem I’m teeming with a lot o’ news,
With many cheerful facts about the square of the hypotenuse.

I’m very good at integral and differential calculus;
I know the scientific names of beings animalculous:
In short, in matters vegetable, animal, and mineral,
I am the very model of a modern Major-General.

Here are a few lines from George Box’s version.

I relentlessly uncover any aberrant contingency
I strangle it with rigor and stifle it with stringency
I understand the different symbols be they Roman, Greek, or cuneiform
And every distribution from the Cauchy to the uniform.

With derivation rigorous each lemma I can justify
My every estimator I am careful to robustify
In short in matters logical, mathematical, idealistical
I am the very model of a professor statistical.

Gilbert & Sullivan have come up on this blog a couple other times:

George Box has come up too, but only once. (I’m surprised he hasn’t come up more; I should rectify that.) This post has a great quote from Box: “To find out what happens to a system when you interfere with it, you have to interfere with it (and not just passively observe it).”

Sum of squares mod n uniformly distributed

Let s be an integer equal to at least 5 and let n be a positive integer.

Look at all tuples of s integers, each integer being between 0 and n − 1 inclusive, and look at the sum of their squares mod n. About 1/n will fall into each possible value.

So, for example, if you look at a lists of 6 digits, sum the squares of the digits in each list, then about 1/10 of the results will end in 0, about 1/10 will end in 1, about 1/10 will end in 2, etc.

This is the gist of a theorem discussed on Math Overflow here.

And here is Python code to demonstrate it.

    from itertools import product

    n = 10
    s = 6

    counts = [0]*n
    for p in product(range(n), repeat=s):
        counts[ sum(x**2 for x in p) % n ] += 1

    print(counts)

The result is

    [103200, 99200, 99200, 99200, 99200, 
     103200, 99200, 99200, 99200, 99200]

and so between 99,200 and 103,200 sums end in each digit.

Let’s run it again with n = 11 and s = 5. Now we get

    [14641, 14762, 14520, 14762, 14762, 14762, 
     14520, 14520, 14520, 14762, 14520]

which shows the counts are between 14,520 and 14,762. If they were perfectly uniformly distributed we’d expect 114 = 14,641 in each bin. The maximum deviation from a uniform distribution is 0.83%.

The code becomes impractical as s or n get larger, but we can try s = 7 and keep n = 11. Then we get a maximum deviation from uniformity of 0.075%, i.e. about 10 times closer to being uniform.

Quirks in Mathematica’s administrative division data for Mexico

If you ask Mathematica for a list of Mexican states via

    CountryData["Mexico", "RegionNames"]

you will get a list of strings:

    "Aguascalientes", "Baja California", ..., "Zacatecas"}

However, when you try to turn this into a list of objects representing these states via

    states = Entity["AdministrativeDivision", {#, "Mexico"}] & /@ 
                 CountryData["Mexico", "RegionNames"]

something strange happens. Some items in the list are turned into useful objects, and some are uninterpreted symbols.

For example, Aguascalientes is recognized as an administrative division, but Baja California is not. It recognizes Oaxaca but not Nuevo León. The pattern is that states with a space are not recognized. There is an inconsistency in Mathematica: output names do not always match input names. To create the object representing Baja California, you need to pass in the string BajaCalifornia with no space.

    Entity["AdministrativeDivision", {"BajaCalifornia", "Mexico"}]

OK, so let’s remove spaces before we try to create a list of geographic objects.

    names = StringReplace[#, " " -> ""] & /@ 
               CountryData["Mexico", "RegionNames"]

This mostly works, but it trips up on Mexico City. The output name for the region is Ciudad de México, but Mathematica does not recognize CiudaddeMéxico as an administrative division. Mathematica does recognize MexicoCity as the name of a city but not as the name of an administrative division.

Changing CiudaddeMéxico to MexicoCity in the list of names did not fix the problem. But when I directly edited the list of state objects by replacing the uninterpreted value with the output running

    Entity["AdministrativeDivision", {"MexicoCity", "Mexico"}]

by itself everything worked. Then I was able to find a Traveling Salesman tour as in earlier posts (Africa, Americas, Eurasia and Oceania, Canada).

Traveling Salesman tour of Mexico

The tour is

  1. Baja California
  2. Baja California Sur
  3. Sinaloa
  4. Durango
  5. Zacatecas
  6. Aguascalientes
  7. Nayarit
  8. Jalisco
  9. Colima
  10. Michoacán
  11. México
  12. Mexico City
  13. Morelos
  14. Guerrero
  15. Oaxaca
  16. Chiapas
  17. Tabasco
  18. Campeche
  19. Quintana Roo
  20. Yucatán
  21. Veracruz
  22. Puebla
  23. Tlaxcala
  24. Hidalgo
  25. Querétaro
  26. Guanajuato
  27. San Luis Potosí
  28. Tamaulipas
  29. Nuevo León
  30. Coahuila
  31. Chihuahua
  32. Sonora

The tour is 8,343 kilometers.

Visualizing Swedish vowels

A few days ago I wrote a post comparing English and Japanese vowel sounds in a 2D chart. In this post I’d like to do something similar for English and Swedish. As before the data come from [1].

A friend of mine who learned Swedish would joke about how terribly he had to contort his mouth to speak the language. Swedish vowels are objectively difficult for non-native speakers as can be seek in a vowel chart. The vertical axis runs from closed sounds on top to open sounds on the bottom. The horizontal axis runs from front vowels on the left to back vowels on the right.

Swedish vowel sounds

There are a lot of vowel sounds, and many of them are clustered close together. Japanese, by contrast, has only five vowel sounds, and they’re widely spread apart.

Japanese vowel sounds

The vowel charts for Spanish and Hebrew look fairly similar to the chart for Japanese above: five vowels spread out in roughly the same locations.

It wouldn’t matter so much that Swedish has a lot of tightly clustered vowel sounds if your native language has the same sounds, but the following chart shows that English and Swedish vowels are quite different. The red x’s mark English vowel locations and the blue dots mark Swedish vowels.

Swedish and English vowel sounds

[1] Handbook of the International Phonetic Association: A Guide to the Use of the International Phonetic Alphabet. Cambridge University Press, 2021.

A traveling salesman tour of Canada

Here is a Traveling Salesman tour of Canada’s provinces and territories created by Mathematica. This is the shortest path connecting the geographic centers of the regions.

Here is a much larger (4.5 MB) PDF file of the same map with higher resolution.

Starting in the northwest, the tour is

  1. Yukon
  2. Northwest Territories
  3. Nunavut
  4. Quebec
  5. Newfoundland and Labrador
  6. Prince Edward Island
  7. Nova Scotia
  8. New Brunswick
  9. Ontario
  10. Manitoba
  11. Saskatchewan
  12. Alberta
  13. British Columbia

The tour is 11,070 km.

For more tours like this, see my earlier posts on tours of

Update: Here is an adjacency network for Canadian provinces and territories.

This is an SVG image so you can scale it to make it easier to read if you’d like.

More adjacency graph posts: